XM Radio 2012 Annual Report Download - page 123
Download and view the complete annual report
Please find page 123 of the 2012 XM Radio annual report below. You can navigate through the pages in the report by either clicking on the pages listed below, or by using the keyword search tool below to find specific information within the annual report.-
 1
1 -
2
-
3
-
4
-
5
-
6
-
7
-
8
-
9
-
10
-
11
-
12
-
13
-
14
-
15
-
16
-
17
-
18
-
19
-
20
-
21
-
22
-
23
-
24
-
25
-
26
-
27
-
28
-
29
-
30
-
31
-
32
-
33
-
34
-
35
-
36
-
37
-
38
-
39
-
40
-
41
-
42
-
43
-
44
-
45
-
46
-
47
-
48
-
49
-
50
-
51
-
52
-
53
-
54
-
55
-
56
-
57
-
58
-
59
-
60
-
61
-
62
-
63
-
64
-
65
-
66
-
67
-
68
-
69
-
70
-
71
-
72
-
73
-
74
-
75
-
76
-
77
-
78
-
79
-
80
-
81
-
82
-
83
-
84
-
85
-
86
-
87
-
88
-
89
-
90
-
91
-
92
-
93
-
94
-
95
-
96
-
97
-
98
-
99
-
100
-
101
-
102
-
103
-
104
-
105
-
106
-
107
-
108
-
109
-
110
-
111
-
112
-
 113
113 -
 114
114 -
 115
115 -
 116
116 -
 117
117 -
 118
118 -
 119
119 -
 120
120 -
 121
121 -
 122
122 -
 123
123 -
 124
124 -
 125
125 -
 126
126 -
 127
127 -
 128
128 -
 129
129 -
 130
130 -
 131
131 -
 132
132
 |
 |

SIRIUS XM RADIO INC. AND SUBSIDIARIES
NOTES TO CONSOLIDATED FINANCIAL STATEMENTS — (Continued)
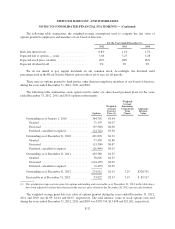
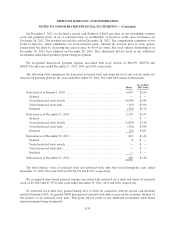
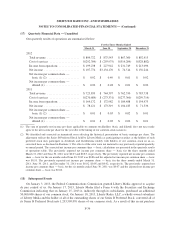
The following table indicates the significant elements contributing to the difference between the federal tax
(benefit) expense at the statutory rate and at our effective rate:
For the Years Ended December 31,
2012 2011 2010
Federal tax expense, at statutory rate ................... $ 166,064 $ 154,418 $ 16,678
State income tax expense, net of federal benefit ........... 16,606 15,751 1,620
State income rate changes ............................ 2,251 3,851 (2,252)
Non-deductible expenses ............................. 477 457 4,130
Change in valuation allowance ........................ (3,195,651) (166,452) (21,749)
Other, net ......................................... 12,019 6,209 6,193
Income tax (benefit) expense ....................... $(2,998,234) $ 14,234 $ 4,620
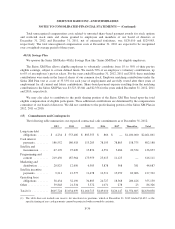
The tax effects of temporary differences that give rise to significant portions of the deferred tax assets and
deferred tax liabilities are represented below:
For the Years Ended December 31,
2012 2011
Deferred tax assets:
Net operating loss carryforwards .......................... $2,493,239 $ 3,025,621
GM payments and liabilities .............................. 80,742 194,976
Deferred revenue ....................................... 511,700 410,812
Severance accrual ...................................... 46 21
Accrued bonus ......................................... 23,798 17,296
Expensed costs capitalized for tax ......................... 26,569 35,227
Loan financing costs .................................... 428 1,575
Investments ........................................... 39,915 40,880
Stock based compensation ............................... 64,636 89,862
Other ................................................ 34,705 42,924
Total deferred tax assets ............................... 3,275,778 3,859,194
Deferred tax liabilities:
Depreciation of property and equipment ..................... (185,007) (405,892)
FCC license ........................................... (772,550) (781,742)
Other intangible assets .................................. (165,227) (188,988)
Other ................................................ — (189)
Total deferred tax liabilities ............................ (1,122,784) (1,376,811)
Net deferred tax assets before valuation allowance .............. 2,152,994 2,482,383
Valuation allowance ...................................... (9,835) (3,360,740)
Total net deferred tax asset (liability) ....................... $2,143,159 $ (878,357)
F-37