XM Radio 2009 Annual Report Download - page 162
Download and view the complete annual report
Please find page 162 of the 2009 XM Radio annual report below. You can navigate through the pages in the report by either clicking on the pages listed below, or by using the keyword search tool below to find specific information within the annual report.-
 1
1 -
2
-
3
-
4
-
5
-
6
-
7
-
8
-
9
-
10
-
11
-
12
-
13
-
14
-
15
-
16
-
17
-
18
-
19
-
20
-
21
-
22
-
23
-
24
-
25
-
26
-
27
-
28
-
29
-
30
-
31
-
32
-
33
-
34
-
35
-
36
-
37
-
38
-
39
-
40
-
41
-
42
-
43
-
44
-
45
-
46
-
47
-
48
-
49
-
50
-
51
-
52
-
53
-
54
-
55
-
56
-
57
-
58
-
59
-
60
-
61
-
62
-
63
-
64
-
65
-
66
-
67
-
68
-
69
-
70
-
71
-
72
-
73
-
74
-
75
-
76
-
77
-
78
-
79
-
80
-
81
-
82
-
83
-
84
-
85
-
86
-
87
-
88
-
89
-
90
-
91
-
92
-
93
-
94
-
95
-
96
-
97
-
98
-
99
-
100
-
101
-
102
-
103
-
104
-
105
-
106
-
107
-
108
-
109
-
110
-
111
-
112
-
113
-
114
-
115
-
116
-
117
-
118
-
119
-
120
-
121
-
122
-
123
-
124
-
125
-
126
-
127
-
128
-
129
-
130
-
131
-
132
-
133
-
134
-
135
-
136
-
137
-
138
-
139
-
140
-
141
-
142
-
143
-
144
-
145
-
146
-
147
-
148
-
149
-
150
-
151
-
 152
152 -
 153
153 -
 154
154 -
 155
155 -
 156
156 -
 157
157 -
 158
158 -
 159
159 -
 160
160 -
 161
161 -
 162
162 -
 163
163 -
 164
164 -
 165
165 -
 166
166 -
 167
167 -
 168
168 -
 169
169 -
 170
170 -
 171
171 -
 172
172 -
173
-
174
-
175
-
176
-
177
-
178
-
179
-
180
-
181
-
182
-
183
-
184
-
185
-
186
-
187
-
188
-
189
-
190
-
191
-
192
-
193
-
194
-
195
-
196
-
197
-
198
-
199
-
200
-
201
-
202
-
203
-
204
-
205
-
206
-
207
 |
 |

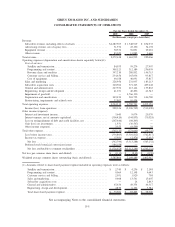
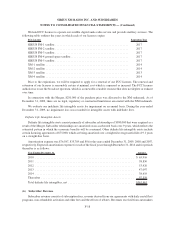
SIRIUS XM RADIO INC. AND SUBSIDIARIES
CONSOLIDATED STATEMENTS OF CASH FLOWS
2009 2008 2007
For the Years Ended December 31,
(In thousands)
Cash flows from operating activities:
Net loss . . . ...................................................... $(342,790) $(5,313,288) $(565,252)
Adjustments to reconcile net loss to net cash provided by (used in) operating activities:
Depreciation and amortization . . ....................................... 309,450 203,752 106,780
Impairment of goodwill . ............................................ — 4,766,190 —
Non-cash interest expense, net of amortization of premium . . . ................... 33,818 (6,311) 4,269
Provision for doubtful accounts . ....................................... 30,602 21,589 9,002
Amortization of deferred income related to equity method investment . .............. (2,776) (1,156) —
Loss on extinguishment of debt and credit facilities, net ........................ 267,646 98,203 —
Restructuring, impairments and related costs . . . ............................. 26,964 — —
Loss (gain) on disposal of assets ....................................... — 4,879 (428)
Loss on investments................................................ 13,664 28,999 —
Share-based payment expense . . ....................................... 73,981 87,405 78,900
Deferred income taxes . . ............................................ 5,981 2,476 2,435
Other non-cash purchase price adjustments ................................. (202,054) (68,330) —
Other . . . ...................................................... — 1,643 —
Changes in operating assets and liabilities:
Accounts receivable . . ............................................ (42,158) (32,121) (28,881)
Inventory ..................................................... 8,269 8,291 4,965
Receivables from distributors . ....................................... (2,788) 14,401 (13,179)
Related party assets . . ............................................ 15,305 (22,249) (1,241)
Prepaid expenses and other current assets . . . ............................. 10,027 (19,953) 11,118
Other long-term assets ............................................ 86,674 (5,490) 13,691
Accounts payable and accrued expenses ................................. (46,645) (83,037) 52,492
Accrued interest................................................. 2,429 23,081 (8,920)
Deferred revenue ................................................ 89,144 73,334 183,582
Related party liabilities ............................................ 54,606 34,646 —
Other long-term liabilities . . . ....................................... 44,481 30,249 1,901
Net cash provided by (used in) operating activities ........................ 433,830 (152,797) (148,766)
Cash flows from investing activities:
Additions to property and equipment ...................................... (248,511) (130,551) (65,264)
Sales of property and equipment . . ....................................... — 105 641
Purchases of restricted and other investments ................................. — (3,000) (310)
Acquisition of acquired entity cash ....................................... — 819,521 —
Merger related costs ................................................. — (23,519) (29,444)
Sale of restricted and other investments. . . .................................. — 65,869 40,191
Net cash (used in) provided by investing activities . ........................ (248,511) 728,425 (54,186)
Cash flows from financing activities:
Proceeds from exercise of warrants and stock options . . . ........................ — 471 4,097
Preferred stock issuance costs, net of costs .................................. (3,712) — —
Long-term borrowings, net of costs ....................................... 582,612 531,743 244,879
Related party long-term borrowings, net of costs . . ............................. 362,593 — —
Payment of premiums on redemption of debt ................................. (17,075) (18,693) —
Payments to noncontrolling interest ....................................... — (61,880) —
Repayment of long-term borrowings ....................................... (755,447) (1,085,643) (625)
Repayment of related party long-term borrowings . ............................. (351,247) — —
Net cash (used in) provided by financing activities ........................ (182,276) (634,002) 248,351
Net increase (decrease) in cash and cash equivalents . ............................. 3,043 (58,374) 45,399
Cash and cash equivalents at beginning of period . . . ............................. 380,446 438,820 393,421
Cash and cash equivalents at end of period . . .................................. $383,489 $ 380,446 $ 438,820
Supplemental Disclosure of Cash and Non-Cash Flow Information Cash paid during the
period for:
Interest, net of amounts capitalized ....................................... $257,328 $ 137,542 $ 66,266
Non-cash investing and financing activities:
Share-based payments in satisfaction of accrued compensation. . . ................... 31,291 8,729 7,949
Common stock issued in exchange of 31⁄2% Convertible Notes due 2008, including accrued
interest . . ...................................................... — 33,502 3,182
Common stock issued in exchange of 21⁄2% Convertible Notes due 2009, including accrued
interest . . ...................................................... 18,000 209,113 2
Structuring fee on 10% Senior PIK Secured Notes due 2011 ....................... 5,918 — —
Preferred stock issued to Liberty Media . . .................................. 227,716 — —
Release of restricted investments . . ....................................... 137,850 — —
Common stock issued to third parties ...................................... — — 82,941
Equity issued in the acquisition of XM . . . .................................. — 5,784,976 —
In-orbit satellite performance incentives . . .................................. 14,905 — —
See accompanying Notes to the consolidated financial statements.
F-8