XM Radio 2009 Annual Report Download - page 109
Download and view the complete annual report
Please find page 109 of the 2009 XM Radio annual report below. You can navigate through the pages in the report by either clicking on the pages listed below, or by using the keyword search tool below to find specific information within the annual report.-
 1
1 -
2
-
3
-
4
-
5
-
6
-
7
-
8
-
9
-
10
-
11
-
12
-
13
-
14
-
15
-
16
-
17
-
18
-
19
-
20
-
21
-
22
-
23
-
24
-
25
-
26
-
27
-
28
-
29
-
30
-
31
-
32
-
33
-
34
-
35
-
36
-
37
-
38
-
39
-
40
-
41
-
42
-
43
-
44
-
45
-
46
-
47
-
48
-
49
-
50
-
51
-
52
-
53
-
54
-
55
-
56
-
57
-
58
-
59
-
60
-
61
-
62
-
63
-
64
-
65
-
66
-
67
-
68
-
69
-
70
-
71
-
72
-
73
-
74
-
75
-
76
-
77
-
78
-
79
-
80
-
81
-
82
-
83
-
84
-
85
-
86
-
87
-
88
-
89
-
90
-
91
-
92
-
93
-
94
-
95
-
96
-
97
-
98
-
 99
99 -
 100
100 -
 101
101 -
 102
102 -
 103
103 -
 104
104 -
 105
105 -
 106
106 -
 107
107 -
 108
108 -
 109
109 -
 110
110 -
 111
111 -
 112
112 -
 113
113 -
 114
114 -
 115
115 -
 116
116 -
 117
117 -
 118
118 -
 119
119 -
120
-
121
-
122
-
123
-
124
-
125
-
126
-
127
-
128
-
129
-
130
-
131
-
132
-
133
-
134
-
135
-
136
-
137
-
138
-
139
-
140
-
141
-
142
-
143
-
144
-
145
-
146
-
147
-
148
-
149
-
150
-
151
-
152
-
153
-
154
-
155
-
156
-
157
-
158
-
159
-
160
-
161
-
162
-
163
-
164
-
165
-
166
-
167
-
168
-
169
-
170
-
171
-
172
-
173
-
174
-
175
-
176
-
177
-
178
-
179
-
180
-
181
-
182
-
183
-
184
-
185
-
186
-
187
-
188
-
189
-
190
-
191
-
192
-
193
-
194
-
195
-
196
-
197
-
198
-
199
-
200
-
201
-
202
-
203
-
204
-
205
-
206
-
207
 |
 |

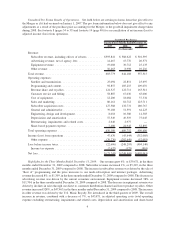
business outlook, and as a means to evaluate period-to-period comparisons. Please refer to the footnotes (pages 32
through 46) following our discussion of results of operations for the definitions and a further discussion of the
usefulness of such non-GAAP financial information and reconciliation to GAAP.
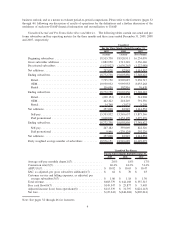
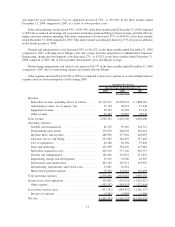
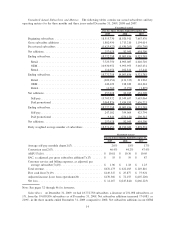
Unaudited Actual and Pro Forma Subscribers and Metrics. The following tables contain our actual and pro
forma subscriber and key operating metrics for the three months and three years ended December 31, 2009, 2008
and 2007, respectively:
2009 2008 2007
For the Three Months Ended December 31,
Unaudited
(Actual) (Actual) (Pro Forma)
Beginning subscribers ........................... 18,515,730 18,920,911 16,234,070
Gross subscriber additions ........................ 1,882,950 1,713,210 2,336,640
Deactivated subscribers .......................... (1,625,922) (1,630,265) (1,222,088)
Net additions .................................. 257,028 82,945 1,114,552
Ending subscribers .............................. 18,772,758 19,003,856 17,348,622
Retail...................................... 7,725,750 8,905,087 9,238,715
OEM...................................... 10,930,952 9,995,953 8,033,268
Rental ..................................... 116,056 102,816 76,639
Ending subscribers .............................. 18,772,758 19,003,856 17,348,622
Retail...................................... (200,154) (131,333) 314,908
OEM...................................... 442,422 218,249 791,356
Rental ..................................... 14,760 (3,971) 8,288
Net additions .................................. 257,028 82,945 1,114,552
Self-pay .................................... 15,703,932 15,549,657 13,873,346
Paid promotional ............................. 3,068,826 3,454,199 3,475,276
Ending subscribers .............................. 18,772,758 19,003,856 17,348,622
Self-pay .................................... 247,182 359,069 822,326
Paid promotional ............................. 9,846 (276,124) 292,226
Net additions .................................. 257,028 82,945 1,114,552
Daily weighted average number of subscribers ......... 18,576,151 18,910,689 16,629,079
2009 2008 2007
For the Three Months Ended December 31,
Unaudited Pro Forma
Average self-pay monthly churn(1)(7). . ................. 2.0% 1.8% 1.7%
Conversion rate(2)(7) ............................... 46.4% 44.2% 51.4%
ARPU(3)(7)...................................... $ 10.92 $ 10.65 $ 10.47
SAC, as adjusted, per gross subscriber addition(4)(7) ....... $ 64 $ 70 $ 83
Customer service and billing expenses, as adjusted, per
average subscriber(5)(7) ........................... $ 1.06 $ 1.18 $ 1.30
Total revenue ..................................... $683,779 $ 644,108 $ 557,515
Free cash flow(6)(7) ............................... $149,547 $ 25,877 $ 5,405
Adjusted income (loss) from operations(8) ............... $115,339 $ 31,797 $(224,143)
Net loss......................................... $(25,243) $(248,468) $(405,041)
Note: See pages 32 through 46 for footnotes.
4