XM Radio 2009 Annual Report Download - page 150
Download and view the complete annual report
Please find page 150 of the 2009 XM Radio annual report below. You can navigate through the pages in the report by either clicking on the pages listed below, or by using the keyword search tool below to find specific information within the annual report.-
 1
1 -
2
-
3
-
4
-
5
-
6
-
7
-
8
-
9
-
10
-
11
-
12
-
13
-
14
-
15
-
16
-
17
-
18
-
19
-
20
-
21
-
22
-
23
-
24
-
25
-
26
-
27
-
28
-
29
-
30
-
31
-
32
-
33
-
34
-
35
-
36
-
37
-
38
-
39
-
40
-
41
-
42
-
43
-
44
-
45
-
46
-
47
-
48
-
49
-
50
-
51
-
52
-
53
-
54
-
55
-
56
-
57
-
58
-
59
-
60
-
61
-
62
-
63
-
64
-
65
-
66
-
67
-
68
-
69
-
70
-
71
-
72
-
73
-
74
-
75
-
76
-
77
-
78
-
79
-
80
-
81
-
82
-
83
-
84
-
85
-
86
-
87
-
88
-
89
-
90
-
91
-
92
-
93
-
94
-
95
-
96
-
97
-
98
-
99
-
100
-
101
-
102
-
103
-
104
-
105
-
106
-
107
-
108
-
109
-
110
-
111
-
112
-
113
-
114
-
115
-
116
-
117
-
118
-
119
-
120
-
121
-
122
-
123
-
124
-
125
-
126
-
127
-
128
-
129
-
130
-
131
-
132
-
133
-
134
-
135
-
136
-
137
-
138
-
139
-
 140
140 -
 141
141 -
 142
142 -
 143
143 -
 144
144 -
 145
145 -
 146
146 -
 147
147 -
 148
148 -
 149
149 -
 150
150 -
 151
151 -
 152
152 -
 153
153 -
 154
154 -
 155
155 -
 156
156 -
 157
157 -
 158
158 -
 159
159 -
 160
160 -
161
-
162
-
163
-
164
-
165
-
166
-
167
-
168
-
169
-
170
-
171
-
172
-
173
-
174
-
175
-
176
-
177
-
178
-
179
-
180
-
181
-
182
-
183
-
184
-
185
-
186
-
187
-
188
-
189
-
190
-
191
-
192
-
193
-
194
-
195
-
196
-
197
-
198
-
199
-
200
-
201
-
202
-
203
-
204
-
205
-
206
-
207
 |
 |

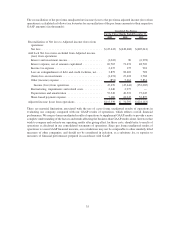
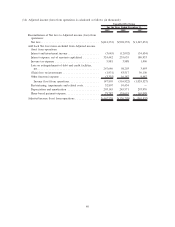
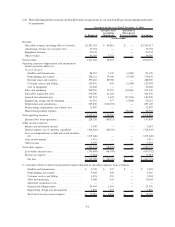
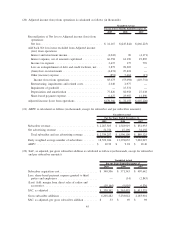
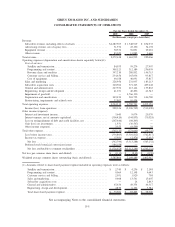
(20) Adjusted income (loss) from operations is calculated as follows (in thousands):
2009 2008 2007
For the Three Months Ended December 31,
Unaudited Actual
Reconciliation of Net loss to Adjusted income (loss) from
operations:
Net loss ....................................... $ 14,167 $(245,844) $(166,223)
Add back Net loss items excluded from Adjusted income
(loss) from operations:
Interest and investment income ...................... (1,043) 90 (4,171)
Interest expense, net of amounts capitalized ............ 66,358 61,196 19,887
Income tax expense .............................. 2,637 175 770
Loss on extinguishment of debt and credit facilities, net . . . 3,879 98,203 —
(Gain) loss on investments ......................... (1,474) 27,418 —
Other (income) expense ........................... (851) 5,664 (17)
Income (loss) from operations ..................... 83,673 (53,098) (149,754)
Restructuring, impairments and related costs ............ 2,640 2,977 —
Impairment of goodwill ........................... — 15,331 —
Depreciation and amortization ...................... 77,826 82,958 27,638
Share-based payment expense ....................... 6,427 23,987 14,896
Adjusted income (loss) from operations ................. $170,566 $ 72,155 $(107,220)
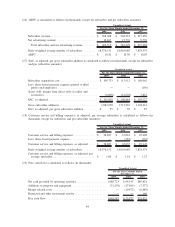
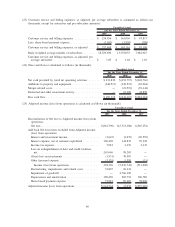
(21) ARPU is calculated as follows (in thousands, except for subscriber and per subscriber amounts):
2009 2008 2007
For the Years Ended December 31,
Unaudited Actual
Subscriber revenue ............................ $ 2,287,503 $ 1,548,919 $ 854,933
Net advertising revenue ........................ 51,754 47,190 34,192
Total subscriber and net advertising revenue ....... $ 2,339,257 $ 1,596,109 $ 889,125
Daily weighted average number of subscribers ....... 18,529,696 13,378,035 7,082,927
ARPU ..................................... $ 10.52 $ 9.94 $ 10.46
(22) SAC, as adjusted, per gross subscriber addition is calculated as follows (in thousands, except for subscriber
and per subscriber amounts):
2009 2008 2007
For the Years Ended December 31,
Unaudited Actual
Subscriber acquisition cost ........................ $ 340,506 $ 371,343 $ 407,642
Less: share-based payment expense granted to third
parties and employees ......................... — (14) (2,843)
(Less) Add: margin from direct sales of radios and
accessories .................................. (10,164) (9,910) 6,536
SAC, as adjusted ............................... $ 330,342 $ 361,419 $ 411,335
Gross subscriber additions ........................ 6,208,482 5,238,042 4,183,901
SAC, as adjusted, per gross subscriber addition ......... $ 53 $ 69 $ 98
45