XM Radio 2009 Annual Report Download - page 116
Download and view the complete annual report
Please find page 116 of the 2009 XM Radio annual report below. You can navigate through the pages in the report by either clicking on the pages listed below, or by using the keyword search tool below to find specific information within the annual report.-
 1
1 -
2
-
3
-
4
-
5
-
6
-
7
-
8
-
9
-
10
-
11
-
12
-
13
-
14
-
15
-
16
-
17
-
18
-
19
-
20
-
21
-
22
-
23
-
24
-
25
-
26
-
27
-
28
-
29
-
30
-
31
-
32
-
33
-
34
-
35
-
36
-
37
-
38
-
39
-
40
-
41
-
42
-
43
-
44
-
45
-
46
-
47
-
48
-
49
-
50
-
51
-
52
-
53
-
54
-
55
-
56
-
57
-
58
-
59
-
60
-
61
-
62
-
63
-
64
-
65
-
66
-
67
-
68
-
69
-
70
-
71
-
72
-
73
-
74
-
75
-
76
-
77
-
78
-
79
-
80
-
81
-
82
-
83
-
84
-
85
-
86
-
87
-
88
-
89
-
90
-
91
-
92
-
93
-
94
-
95
-
96
-
97
-
98
-
99
-
100
-
101
-
102
-
103
-
104
-
105
-
 106
106 -
 107
107 -
 108
108 -
 109
109 -
 110
110 -
 111
111 -
 112
112 -
 113
113 -
 114
114 -
 115
115 -
 116
116 -
 117
117 -
 118
118 -
 119
119 -
 120
120 -
 121
121 -
 122
122 -
 123
123 -
 124
124 -
 125
125 -
 126
126 -
127
-
128
-
129
-
130
-
131
-
132
-
133
-
134
-
135
-
136
-
137
-
138
-
139
-
140
-
141
-
142
-
143
-
144
-
145
-
146
-
147
-
148
-
149
-
150
-
151
-
152
-
153
-
154
-
155
-
156
-
157
-
158
-
159
-
160
-
161
-
162
-
163
-
164
-
165
-
166
-
167
-
168
-
169
-
170
-
171
-
172
-
173
-
174
-
175
-
176
-
177
-
178
-
179
-
180
-
181
-
182
-
183
-
184
-
185
-
186
-
187
-
188
-
189
-
190
-
191
-
192
-
193
-
194
-
195
-
196
-
197
-
198
-
199
-
200
-
201
-
202
-
203
-
204
-
205
-
206
-
207
 |
 |

and improved scale efficiencies. Cost of equipment decreased 52%, or $19,250, in the three months ended
December 31, 2008 compared to 2007 as a result of lower product costs.
Sales and marketing cost decreased 34%, or $41,999, in the three months ended December 31, 2008 compared
to 2007 due to reduced advertising and cooperative marketing spend and Merger related savings, partially offset by
higher customer retention spending. Subscriber acquisition costs decreased 27%, or $48,036, in the three months
ended December 31, 2008 compared to 2007. This improvement was primarily driven by 27% lower gross additions
in the fourth quarter of 2008.
General and administrative costs decreased 20%, or $12,632, in the three months ended December 31, 2008
compared to 2007, reflecting lower Merger costs and savings from the integration of administrative functions.
Engineering, design and development costs decreased 27%, or $3,923, in the three months ended December 31,
2008 compared to 2007 due to lower product development costs and Merger savings.
Restructuring, impairments and related costs increased $2,977 in the three months ended December 31, 2008
compared to 2007 due to restructuring charges associated with the Merger.
Other expenses increased by $150,594 or 289% as compared to prior year’s quarter as a result of higher interest
expense and loss from redemption of debt during 2008.
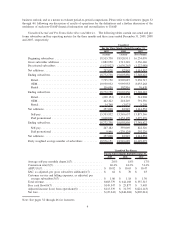
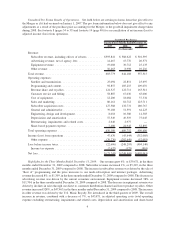
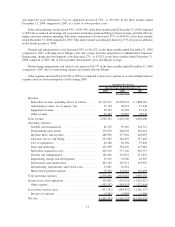
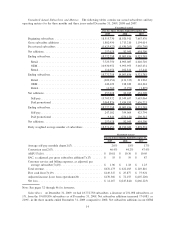
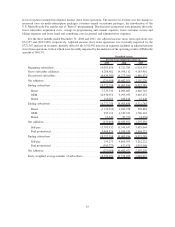
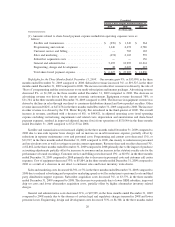
2009 2008 2007
For the Years Ended December 31,
Unaudited Pro Forma
(In thousands)
Revenue:
Subscriber revenue, including effects of rebates ...... $2,334,317 $2,258,322 $ 1,888,709
Advertising revenue, net of agency fees ............ 51,754 69,933 73,340
Equipment revenue ........................... 50,352 69,398 57,614
Other revenue ............................... 90,280 39,087 38,945
Total revenue ................................. 2,526,703 2,436,740 2,058,608
Operating expenses:
Satellite and transmission ...................... 82,170 99,185 101,721
Programming and content ...................... 370,470 446,638 401,461
Revenue share and royalties..................... 486,990 477,962 403,059
Customer service and billing .................... 232,405 244,195 217,402
Cost of equipment ............................ 40,188 66,104 97,820
Sales and marketing .......................... 232,199 342,296 413,084
Subscriber acquisition costs ..................... 401,670 577,126 654,775
General and administrative ..................... 181,920 267,032 271,831
Engineering, design and development . ............ 36,152 52,500 62,907
Depreciation and amortization ................... 203,145 245,571 293,976
Restructuring, impairments and related costs ........ 32,807 10,434 —
Share-based payment expense ................... 78,782 124,619 165,099
Total operating expenses ......................... 2,378,898 2,953,662 3,083,135
Income (loss) from operations ..................... 147,805 (516,922) (1,024,527)
Other expense ............................... (583,157) (381,425) (221,610)
Loss before income taxes ........................ (435,352) (898,347) (1,246,137)
Income tax expense ........................... (5,981) (3,988) (1,496)
Net loss ..................................... $(441,333) $ (902,335) $(1,247,633)
11