XM Radio 2009 Annual Report Download - page 137
Download and view the complete annual report
Please find page 137 of the 2009 XM Radio annual report below. You can navigate through the pages in the report by either clicking on the pages listed below, or by using the keyword search tool below to find specific information within the annual report.
using the hybrid approach for volatility, which weights observable historical volatility and implied volatility of
qualifying actively traded options on our common stock. The expected life assumption represents the weighted-
average period stock-based awards are expected to remain outstanding. These expected life assumptions are
established through a review of historical exercise behavior of stock-based award grants with similar vesting
periods. Where historical patterns do not exist, contractual terms are used. The risk-free interest rate represents the
daily treasury yield curve rate at the grant date based on the closing market bid yields on actively traded
U.S. treasury securities in the over-the-counter market for the expected term. Our assumptions may change in future
periods.
Equity instruments granted to non-employees are recognized in earnings at the estimated fair value, which is
remeasured during the performance commitment period. The final measurement date for the fair value of equity
instruments is the date that each performance commitment for such equity instrument is satisfied or there is a
significant disincentive for non-performance.
Stock-based awards granted to employees, non-employees and members of our board of directors include
warrants, stock options, restricted stock and restricted stock units.
Income Taxes. Deferred income taxes are recognized for the tax consequences related to temporary
differences between the carrying amount of assets and liabilities for financial reporting purposes and the amounts
used for tax purposes at each year-end, based on enacted tax laws and statutory tax rates applicable to the periods in
which the differences are expected to affect taxable income. Avaluation allowance is recognized when, based on the
weight of all available evidence, it is considered more likely than not that all, or some portion, of the deferred tax
assets will not be realized. Income tax expense is the sum of current income tax plus the change in deferred tax
assets and liabilities.
Footnotes to Results of Operations
(1) Average self-pay monthly churn represents the monthly average of self-pay deactivations by the quarter divided
by the average self-pay subscriber balance for the quarter.
(2) We measure the percentage of vehicle owners and lessees that receive our service and convert to self-paying
after the initial promotion period. We refer to this as the “conversion rate.” At the time of sale, vehicle owners
and lessees generally receive between three and twelve month trial subscriptions. Promotional periods
generally include the period of trial service plus 30 days to handle the receipt and processing of payments.
We measure conversion rate three months after the period in which the trial service ends. Based on our
experience it may take up to 90 days after the trial service ends for vehicle owners and lessees to respond to our
marketing communications and become self-paying subscribers.
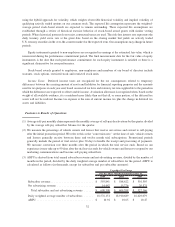
(3) ARPU is derived from total earned subscriber revenue and net advertising revenue, divided by the number of
months in the period, divided by the daily weighted average number of subscribers for the period. ARPU is
calculated as follows (in thousands, except for subscriber and per subscriber amounts):
2009 2008 2007
For the Three Months Ended December 31,
Unaudited Pro Forma
Subscriber revenue ........................... $ 593,841 $ 588,622 $ 501,595
Net advertising revenue . ...................... 14,467 15,776 20,571
Total subscriber and net advertising revenue ...... $ 608,308 $ 604,398 $ 522,166
Daily weighted average number of subscribers ...... 18,576,151 18,910,689 16,629,079
ARPU .................................... $ 10.92 $ 10.65 $ 10.47
32


