XM Radio 2009 Annual Report Download - page 146
Download and view the complete annual report
Please find page 146 of the 2009 XM Radio annual report below. You can navigate through the pages in the report by either clicking on the pages listed below, or by using the keyword search tool below to find specific information within the annual report.-
 1
1 -
2
-
3
-
4
-
5
-
6
-
7
-
8
-
9
-
10
-
11
-
12
-
13
-
14
-
15
-
16
-
17
-
18
-
19
-
20
-
21
-
22
-
23
-
24
-
25
-
26
-
27
-
28
-
29
-
30
-
31
-
32
-
33
-
34
-
35
-
36
-
37
-
38
-
39
-
40
-
41
-
42
-
43
-
44
-
45
-
46
-
47
-
48
-
49
-
50
-
51
-
52
-
53
-
54
-
55
-
56
-
57
-
58
-
59
-
60
-
61
-
62
-
63
-
64
-
65
-
66
-
67
-
68
-
69
-
70
-
71
-
72
-
73
-
74
-
75
-
76
-
77
-
78
-
79
-
80
-
81
-
82
-
83
-
84
-
85
-
86
-
87
-
88
-
89
-
90
-
91
-
92
-
93
-
94
-
95
-
96
-
97
-
98
-
99
-
100
-
101
-
102
-
103
-
104
-
105
-
106
-
107
-
108
-
109
-
110
-
111
-
112
-
113
-
114
-
115
-
116
-
117
-
118
-
119
-
120
-
121
-
122
-
123
-
124
-
125
-
126
-
127
-
128
-
129
-
130
-
131
-
132
-
133
-
134
-
135
-
 136
136 -
 137
137 -
 138
138 -
 139
139 -
 140
140 -
 141
141 -
 142
142 -
 143
143 -
 144
144 -
 145
145 -
 146
146 -
 147
147 -
 148
148 -
 149
149 -
 150
150 -
 151
151 -
 152
152 -
 153
153 -
 154
154 -
 155
155 -
 156
156 -
157
-
158
-
159
-
160
-
161
-
162
-
163
-
164
-
165
-
166
-
167
-
168
-
169
-
170
-
171
-
172
-
173
-
174
-
175
-
176
-
177
-
178
-
179
-
180
-
181
-
182
-
183
-
184
-
185
-
186
-
187
-
188
-
189
-
190
-
191
-
192
-
193
-
194
-
195
-
196
-
197
-
198
-
199
-
200
-
201
-
202
-
203
-
204
-
205
-
206
-
207
 |
 |

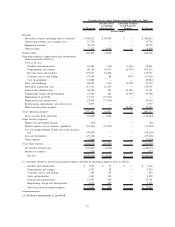
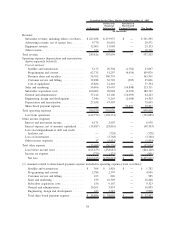
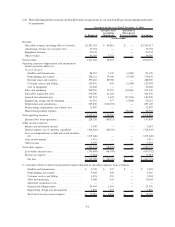
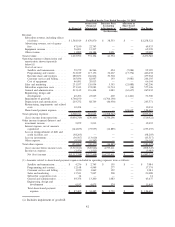
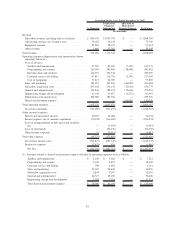
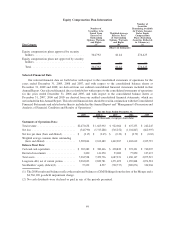
(15) The following tables reconcile our GAAP results of operations to our non-GAAP pro forma unadjusted results
of operations:
As Reported
Purchase Price
Accounting
Adjustments
Allocation of
Share-based
Payment Expense Pro Forma
Unaudited for the Year Ended December 31, 2009
(In thousands)
Revenue:
Subscriber revenue, including effects of rebates . . . . . $2,287,503 $ 46,814 $ — $2,334,317
Advertising revenue, net of agency fees . . . . . . . . . . 51,754 — — 51,754
Equipment revenue . . . . . . . . . . . . . . . . . . . . . . . . . 50,352 — — 50,352
Other revenue . . . . . . . . . . . . . . . . . . . . . . . . . . . . 83,029 7,251 — 90,280
Total revenue . . . . . . . . . . . . . . . . . . . . . . . . . . . . . . 2,472,638 54,065 — 2,526,703
Operating expenses (depreciation and amortization
shown separately below)(1)
Cost of services:
Satellite and transmission. . . . . . . . . . . . . . . . . . . 84,033 1,339 (3,202) 82,170
Programming and content . . . . . . . . . . . . . . . . . . 308,121 72,069 (9,720) 370,470
Revenue share and royalties . . . . . . . . . . . . . . . . . 397,210 89,780 — 486,990
Customer service and billing . . . . . . . . . . . . . . . . 234,456 453 (2,504) 232,405
Cost of equipment . . . . . . . . . . . . . . . . . . . . . . . 40,188 — — 40,188
Sales and marketing . . . . . . . . . . . . . . . . . . . . . . . . 228,956 13,507 (10,264) 232,199
Subscriber acquisition costs . . . . . . . . . . . . . . . . . . . 340,506 61,164 — 401,670
General and administrative . . . . . . . . . . . . . . . . . . . 227,554 1,602 (47,236) 181,920
Engineering, design and development . . . . . . . . . . . . 41,031 977 (5,856) 36,152
Depreciation and amortization . . . . . . . . . . . . . . . . . 309,450 (106,305) — 203,145
Restructuring, impairments and related costs . . . . . . . 32,807 — — 32,807
Share-based payment expense . . . . . . . . . . . . . . . . . — — 78,782 78,782
Total operating expenses. . . . . . . . . . . . . . . . . . . . . . . 2,244,312 134,586 — 2,378,898
Income (loss) from operations . . . . . . . . . . . . . . . . . 228,326 (80,521) — 147,805
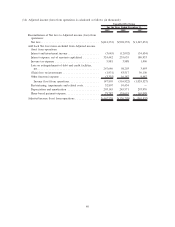
Other income (expense)
Interest and investment income . . . . . . . . . . . . . . . . 3,645 — — 3,645
Interest expense, net of amounts capitalized . . . . . . . (306,420) (18,022) — (324,442)
Loss on extinguishment of debt and credit facilities,
net . . . . . . . . . . . . . . . . . . . . . . . . . . . . . . . . . . (267,646) — — (267,646)
Gain on investments . . . . . . . . . . . . . . . . . . . . . . . . 1,931 — — 1,931
Other income . . . . . . . . . . . . . . . . . . . . . . . . . . . . . 3,355 — — 3,355
Total other expense . . . . . . . . . . . . . . . . . . . . . . . . . . (565,135) (18,022) — (583,157)
Loss before income taxes . . . . . . . . . . . . . . . . . . . . (336,809) (98,543) — (435,352)
Income tax expense . . . . . . . . . . . . . . . . . . . . . . . . (5,981) — — (5,981)
Net loss . . . . . . . . . . . . . . . . . . . . . . . . . . . . . . . $ (342,790) $ (98,543) $ — $ (441,333)
(1) Amounts related to share-based payment expense included in operating expenses were as follows:
Satellite and transmission. . . . . . . . . . . . . . . . . . . $ 2,745 $ 457 $ — $ 3,202
Programming and content . . . . . . . . . . . . . . . . . . 9,064 656 — 9,720
Customer service and billing . . . . . . . . . . . . . . . . 2,051 453 — 2,504
Sales and marketing . . . . . . . . . . . . . . . . . . . . . . 9,608 656 — 10,264
Subscriber acquisition costs . . . . . . . . . . . . . . . . . — — — —
General and administrative. . . . . . . . . . . . . . . . . . 45,634 1,602 — 47,236
Engineering, design and development . . . . . . . . . . 4,879 977 — 5,856
Total share-based payment expense . . . . . . . . . . . . $ 73,981 $ 4,801 $ — $ 78,782
41