XM Radio 2009 Annual Report Download - page 138
Download and view the complete annual report
Please find page 138 of the 2009 XM Radio annual report below. You can navigate through the pages in the report by either clicking on the pages listed below, or by using the keyword search tool below to find specific information within the annual report.-
 1
1 -
2
-
3
-
4
-
5
-
6
-
7
-
8
-
9
-
10
-
11
-
12
-
13
-
14
-
15
-
16
-
17
-
18
-
19
-
20
-
21
-
22
-
23
-
24
-
25
-
26
-
27
-
28
-
29
-
30
-
31
-
32
-
33
-
34
-
35
-
36
-
37
-
38
-
39
-
40
-
41
-
42
-
43
-
44
-
45
-
46
-
47
-
48
-
49
-
50
-
51
-
52
-
53
-
54
-
55
-
56
-
57
-
58
-
59
-
60
-
61
-
62
-
63
-
64
-
65
-
66
-
67
-
68
-
69
-
70
-
71
-
72
-
73
-
74
-
75
-
76
-
77
-
78
-
79
-
80
-
81
-
82
-
83
-
84
-
85
-
86
-
87
-
88
-
89
-
90
-
91
-
92
-
93
-
94
-
95
-
96
-
97
-
98
-
99
-
100
-
101
-
102
-
103
-
104
-
105
-
106
-
107
-
108
-
109
-
110
-
111
-
112
-
113
-
114
-
115
-
116
-
117
-
118
-
119
-
120
-
121
-
122
-
123
-
124
-
125
-
126
-
127
-
 128
128 -
 129
129 -
 130
130 -
 131
131 -
 132
132 -
 133
133 -
 134
134 -
 135
135 -
 136
136 -
 137
137 -
 138
138 -
 139
139 -
 140
140 -
 141
141 -
 142
142 -
 143
143 -
 144
144 -
 145
145 -
 146
146 -
 147
147 -
 148
148 -
149
-
150
-
151
-
152
-
153
-
154
-
155
-
156
-
157
-
158
-
159
-
160
-
161
-
162
-
163
-
164
-
165
-
166
-
167
-
168
-
169
-
170
-
171
-
172
-
173
-
174
-
175
-
176
-
177
-
178
-
179
-
180
-
181
-
182
-
183
-
184
-
185
-
186
-
187
-
188
-
189
-
190
-
191
-
192
-
193
-
194
-
195
-
196
-
197
-
198
-
199
-
200
-
201
-
202
-
203
-
204
-
205
-
206
-
207
 |
 |

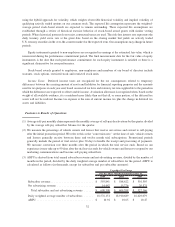
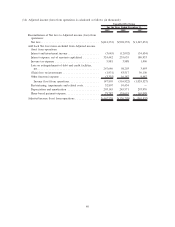
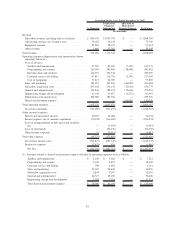
(4) SAC, as adjusted, per gross subscriber addition is derived from subscriber acquisition costs and margins from
the direct sale of radios and accessories, excluding share-based payment expense, divided by the number of
gross subscriber additions for the period. SAC, as adjusted, per gross subscriber addition is calculated as follows
(in thousands, except for subscriber and per subscriber amounts):
2009 2008 2007
For the Three Months Ended December 31,
Unaudited Pro Forma
Subscriber acquisition cost ........................ $ 127,588 $ 132,731 $ 190,090
Less: share-based payment expense granted to third
parties and employees ......................... — — (9,323)
(Less) Add: margin from direct sales of radios and
accessories .................................. (6,808) (12,628) 12,201
SAC, as adjusted ............................... $ 120,780 $ 120,103 $ 192,968
Gross subscriber additions ........................ 1,882,950 1,713,210 2,336,640
SAC, as adjusted, per gross subscriber addition ......... $ 64 $ 70 $ 83
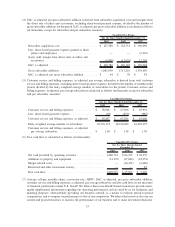
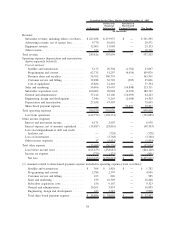
(5) Customer service and billing expenses, as adjusted, per average subscriber is derived from total customer
service and billing expenses, excluding share-based payment expense, divided by the number of months in the
period, divided by the daily weighted average number of subscribers for the period. Customer service and
billing expenses, as adjusted, per average subscriber is calculated as follows (in thousands, except for subscriber
and per subscriber amounts):
2009 2008 2007
For the Three Months Ended December 31,
Unaudited Pro Forma
Customer service and billing expenses ............ $ 58,981 $ 67,906 $ 65,991
Less: share-based payment expense ............... (94) (870) (985)
Customer service and billing expenses, as adjusted . . . $ 58,887 $ 67,036 $ 65,006
Daily weighted average number of subscribers ...... 18,576,151 18,910,689 16,629,079
Customer service and billing expenses, as adjusted,
per average subscriber. ...................... $ 1.06 $ 1.18 $ 1.30
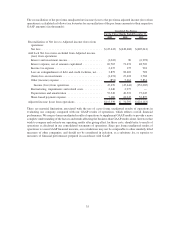
(6) Free cash flow is calculated as follows (in thousands):
2009 2008 2007
For the Three Months Ended
December 31,
Unaudited Pro Forma
Net cash provided by operating activities .................. $180,723 $ 64,195 $ 30,957
Additions to property and equipment ..................... (31,176) (27,846) (18,954)
Merger related costs ................................. — (10,472) (6,680)
Restricted and other investment activity ................... — — 82
Free cash flow. ..................................... $149,547 $ 25,877 $ 5,405
(7) Average self-pay monthly churn; conversion rate; ARPU; SAC, as adjusted, per gross subscriber addition;
customer service and billing expenses, as adjusted, per average subscriber; and free cash flow are not measures
of financial performance under U.S. GAAP. We believe these non-GAAP financial measures provide mean-
ingful supplemental information regarding our operating performance and are used by us for budgetary and
planning purposes; when publicly providing our business outlook; as a means to evaluate period-to-period
comparisons; and to compare our performance to that of our competitors. We believe that investors also use our
current and projected metrics to monitor the performance of our business and to make investment decisions.
33