XM Radio 2009 Annual Report Download - page 113
Download and view the complete annual report
Please find page 113 of the 2009 XM Radio annual report below. You can navigate through the pages in the report by either clicking on the pages listed below, or by using the keyword search tool below to find specific information within the annual report.-
 1
1 -
2
-
3
-
4
-
5
-
6
-
7
-
8
-
9
-
10
-
11
-
12
-
13
-
14
-
15
-
16
-
17
-
18
-
19
-
20
-
21
-
22
-
23
-
24
-
25
-
26
-
27
-
28
-
29
-
30
-
31
-
32
-
33
-
34
-
35
-
36
-
37
-
38
-
39
-
40
-
41
-
42
-
43
-
44
-
45
-
46
-
47
-
48
-
49
-
50
-
51
-
52
-
53
-
54
-
55
-
56
-
57
-
58
-
59
-
60
-
61
-
62
-
63
-
64
-
65
-
66
-
67
-
68
-
69
-
70
-
71
-
72
-
73
-
74
-
75
-
76
-
77
-
78
-
79
-
80
-
81
-
82
-
83
-
84
-
85
-
86
-
87
-
88
-
89
-
90
-
91
-
92
-
93
-
94
-
95
-
96
-
97
-
98
-
99
-
100
-
101
-
102
-
 103
103 -
 104
104 -
 105
105 -
 106
106 -
 107
107 -
 108
108 -
 109
109 -
 110
110 -
 111
111 -
 112
112 -
 113
113 -
 114
114 -
 115
115 -
 116
116 -
 117
117 -
 118
118 -
 119
119 -
 120
120 -
 121
121 -
 122
122 -
 123
123 -
124
-
125
-
126
-
127
-
128
-
129
-
130
-
131
-
132
-
133
-
134
-
135
-
136
-
137
-
138
-
139
-
140
-
141
-
142
-
143
-
144
-
145
-
146
-
147
-
148
-
149
-
150
-
151
-
152
-
153
-
154
-
155
-
156
-
157
-
158
-
159
-
160
-
161
-
162
-
163
-
164
-
165
-
166
-
167
-
168
-
169
-
170
-
171
-
172
-
173
-
174
-
175
-
176
-
177
-
178
-
179
-
180
-
181
-
182
-
183
-
184
-
185
-
186
-
187
-
188
-
189
-
190
-
191
-
192
-
193
-
194
-
195
-
196
-
197
-
198
-
199
-
200
-
201
-
202
-
203
-
204
-
205
-
206
-
207
 |
 |
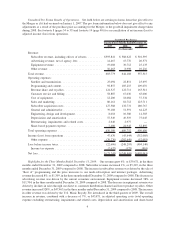
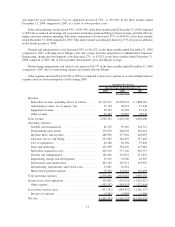
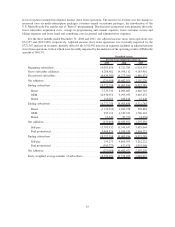
For the years ended December 31, 2008 and 2007, Customer service and billing expenses, as adjusted, per
average subscriber was $1.11 and $1.18, respectively. The decline was primarily due to efficiencies across a larger
subscriber base.
Adjusted Income (Loss) from Operations. For the years ended December 31, 2009 and 2008, our adjusted
income (loss) from operations was $462,539 and ($136,298), respectively. Adjusted income (loss) from operations
was favorably impacted by an increase of 4%, or $89,963, in revenues and a decrease of 20%, or $508,874, in total
expenses included in adjusted income (loss) from operations. The increase in revenue was due mainly to an increase
in weighted average subscribers as well as increased rates on multi-subscription packages, revenues earned on
internet packages, the introduction of the U.S. Music Royalty Fee and the sale of “Best of” programming, partially
offset by decreased by equipment revenue. The decreases in expenses were primarily driven by lower subscriber
acquisition costs, lower sales and marketing discretionary spend, savings in programming and content expenses,
and lower legal and consulting costs in general and administrative expenses.
For the years ended December 31, 2008 and 2007, our adjusted income (loss) from operations was ($136,298)
and ($565,452), respectively. Adjusted income (loss) from operations was favorably impacted by an increase of
18%, or $378,132, in revenues and a decrease of 2%, or $51,022, in total expenses included in adjusted income
(loss) from operations.
8