XM Radio 2009 Annual Report Download - page 119
Download and view the complete annual report
Please find page 119 of the 2009 XM Radio annual report below. You can navigate through the pages in the report by either clicking on the pages listed below, or by using the keyword search tool below to find specific information within the annual report.
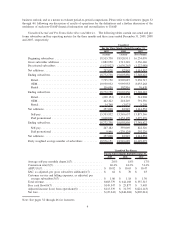
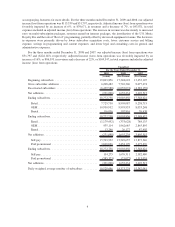
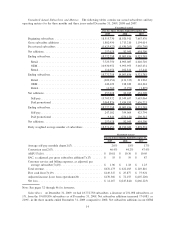
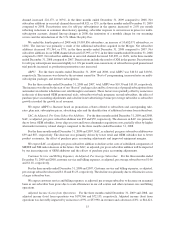
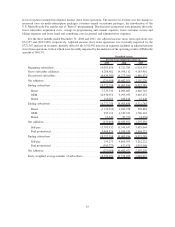
Unaudited Actual Subscribers and Metrics. The following tables contain our actual subscribers and key
operating metrics for the three months and three years ended December 31, 2009, 2008 and 2007:
2009 2008 2007
For the Three Months Ended December 31,
Unaudited Actual
Beginning subscribers ............................ 18,515,730 18,920,911 7,667,476
Gross subscriber additions ......................... 1,882,950 1,713,210 1,194,014
Deactivated subscribers ........................... (1,625,922) (1,630,265) (539,705)
Net additions ................................... 257,028 82,945 654,309
Ending subscribers ............................... 18,772,758 19,003,856 8,321,785
Retail ...................................... 7,725,750 8,905,087 4,640,710
OEM....................................... 10,930,952 9,995,953 3,665,631
Rental ...................................... 116,056 102,816 15,444
Ending subscribers ............................... 18,772,758 19,003,856 8,321,785
Retail ...................................... (200,154) (131,333) 211,962
OEM....................................... 442,422 218,249 444,244
Rental ...................................... 14,760 (3,971) (1,897)
Net additions ................................... 257,028 82,945 654,309
Self-pay ..................................... 15,703,932 15,549,657 5,685,064
Paid promotional .............................. 3,068,826 3,454,199 2,636,721
Ending subscribers ............................... 18,772,758 19,003,856 8,321,785
Self-pay ..................................... 247,182 359,069 423,794
Paid promotional .............................. 9,846 (276,124) 230,515
Net additions ................................... 257,028 82,945 654,309
Daily weighted average number of subscribers .......... 18,576,151 18,910,689 7,878,574
2009 2008 2007
For the Three Months Ended December 31,
Unaudited Actual
Average self-pay monthly churn(1)(7). . ................. 2.0% 1.8% 1.7%
Conversion rate(2)(7) ............................... 46.4% 44.2% 47.4%
ARPU(7)(16) ..................................... $ 10.81 $ 10.30 $ 10.05
SAC, as adjusted, per gross subscriber addition(7)(17) ...... $ 55 $ 59 $ 87
Customer service and billing expenses, as adjusted, per
average subscriber(7)(18) .......................... $ 1.06 $ 1.18 $ 1.23
Total revenue ..................................... $676,173 $ 622,183 $ 249,816
Free cash flow(7)(19)............................... $149,547 $ 25,877 $ 75,921
Adjusted income (loss) from operations(20) .............. $170,566 $ 72,155 $(107,220)
Net loss......................................... $ 14,167 $(245,844) $(166,223)
Note: See pages 32 through 46 for footnotes.
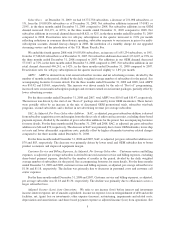
Subscribers. At December 31, 2009, we had 18,772,758 subscribers, a decrease of 231,098 subscribers, or
1%, from the 19,003,856 subscribers as of December 31, 2008. Net subscriber additions increased 174,083, or
210%, in the three months ended December 31, 2009 compared to 2008. Net subscriber additions in our OEM
14


