XM Radio 2009 Annual Report Download - page 122
Download and view the complete annual report
Please find page 122 of the 2009 XM Radio annual report below. You can navigate through the pages in the report by either clicking on the pages listed below, or by using the keyword search tool below to find specific information within the annual report.-
 1
1 -
2
-
3
-
4
-
5
-
6
-
7
-
8
-
9
-
10
-
11
-
12
-
13
-
14
-
15
-
16
-
17
-
18
-
19
-
20
-
21
-
22
-
23
-
24
-
25
-
26
-
27
-
28
-
29
-
30
-
31
-
32
-
33
-
34
-
35
-
36
-
37
-
38
-
39
-
40
-
41
-
42
-
43
-
44
-
45
-
46
-
47
-
48
-
49
-
50
-
51
-
52
-
53
-
54
-
55
-
56
-
57
-
58
-
59
-
60
-
61
-
62
-
63
-
64
-
65
-
66
-
67
-
68
-
69
-
70
-
71
-
72
-
73
-
74
-
75
-
76
-
77
-
78
-
79
-
80
-
81
-
82
-
83
-
84
-
85
-
86
-
87
-
88
-
89
-
90
-
91
-
92
-
93
-
94
-
95
-
96
-
97
-
98
-
99
-
100
-
101
-
102
-
103
-
104
-
105
-
106
-
107
-
108
-
109
-
110
-
111
-
 112
112 -
 113
113 -
 114
114 -
 115
115 -
 116
116 -
 117
117 -
 118
118 -
 119
119 -
 120
120 -
 121
121 -
 122
122 -
 123
123 -
 124
124 -
 125
125 -
 126
126 -
 127
127 -
 128
128 -
 129
129 -
 130
130 -
 131
131 -
 132
132 -
133
-
134
-
135
-
136
-
137
-
138
-
139
-
140
-
141
-
142
-
143
-
144
-
145
-
146
-
147
-
148
-
149
-
150
-
151
-
152
-
153
-
154
-
155
-
156
-
157
-
158
-
159
-
160
-
161
-
162
-
163
-
164
-
165
-
166
-
167
-
168
-
169
-
170
-
171
-
172
-
173
-
174
-
175
-
176
-
177
-
178
-
179
-
180
-
181
-
182
-
183
-
184
-
185
-
186
-
187
-
188
-
189
-
190
-
191
-
192
-
193
-
194
-
195
-
196
-
197
-
198
-
199
-
200
-
201
-
202
-
203
-
204
-
205
-
206
-
207
 |
 |

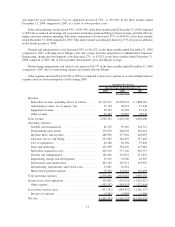
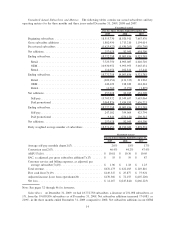
2009 2008 2007
For the Years Ended December 31,
Unaudited Actual
Average self-pay monthly churn(1)(7) ................ 2.0% 1.8% 1.6%
Conversion rate(2)(7) ............................ 45.4% 47.5% 47.5%
ARPU(7)(21) .................................. $ 10.52 $ 9.94 $ 10.46
SAC, as adjusted, per gross subscriber addition(7)(22) .... $ 53 $ 69 $ 98
Customer service and billing expenses, as adjusted, per
average subscriber(7)(23) ....................... $ 1.05 $ 1.02 $ 1.10
Total revenue .................................. $2,472,638 $ 1,663,992 $ 922,066
Free cash flow(7)(24) ............................ $ 185,319 $ (244,467) $(218,624)
Adjusted income (loss) from operations(25) ........... $ 644,564 $ 31,032 $(327,410)
Net loss . ..................................... $ (342,790) $(5,313,288) $(565,252)
Note: See pages 32 through 46 for footnotes.
Subscribers. At December 31, 2009, we had 18,772,758 subscribers, a decrease of 231,098 subscribers, or
1%, from the 19,003,856 subscribers as of December 31, 2008. The decrease was principally the result of 385,373
fewer paid promotional trials due to the decline in North American auto sales. This decline was partially offset by an
increase of 154,275 in self-pay subscribers compared to December 31, 2008. Deactivation rates for self-pay
subscriptions in the quarter increased to 2.0% per month reflecting reductions in consumer discretionary spending,
subscriber response to our increase in prices for multi-subscription accounts, channel line-up changes in 2008, the
institution of a monthly charge for our streaming service and the introduction of the U.S. Music Royalty Fee.
We ended 2008 with 19,003,856 subscribers, an increase of 128% from the 8,321,785 subscribers as of
December 31, 2007. The increase was a result of the 9,716,070 subscribers acquired in the Merger. Gross additions
in our OEM channel continued to grow as automakers continued to increase the portion of their production which
incorporates satellite radio. The growth in OEM gross additions was offset by declines in retail gross additions.
Deactivations include the results of XM from the date of the Merger. The deactivation rate for self-pay subscriptions
increased slightly to 1.8% while the conversion rate for subscribers in paid promotional trial periods stayed
constant.
ARPU. For the years ended December 31, 2009 and 2008, total ARPU was $10.52 and $9.94, respectively.
The increase was driven by the revenues earned for “Best of” programming, increased rates on multi-subscription
packages and internet subscriptions.
For the years ended December 31, 2008 and 2007, total ARPU was $9.94 and $10.46, respectively. The
decrease was driven by an increase in the mix of discounted OEM promotional trials, subscriber win-back
programs, second subscribers, the effect of purchase price accounting adjustments and a decline in net advertising
revenue per average subscriber as subscriber growth exceeded the growth in ad revenues.
We expect ARPU to fluctuate based on promotions, rebates offered to subscribers and corresponding take-
rates, plan mix, subscription prices, advertising sales and the identification of additional revenue from subscribers.
SAC, As Adjusted, Per Gross Subscriber Addition. For the years ended December 31, 2009 and 2008, SAC, as
adjusted, per gross subscriber addition was $53 and $69, respectively. The decrease was primarily driven by the
effect of purchase price accounting adjustments, lower OEM subsidies, decreased production of certain radios,
lower aftermarket inventory reserves and improved equipment margins in the year ended December 31, 2009
compared to 2008.
For the years ended December 31, 2008 and 2007, SAC, as adjusted, per gross subscriber addition was $69 and
$98, respectively. The decrease was primarily driven by lower retail and OEM subsidies due to better product
economics, the effect of purchase price accounting adjustments and improved equipment margins.
17