XM Radio 2009 Annual Report Download - page 118
Download and view the complete annual report
Please find page 118 of the 2009 XM Radio annual report below. You can navigate through the pages in the report by either clicking on the pages listed below, or by using the keyword search tool below to find specific information within the annual report.-
 1
1 -
2
-
3
-
4
-
5
-
6
-
7
-
8
-
9
-
10
-
11
-
12
-
13
-
14
-
15
-
16
-
17
-
18
-
19
-
20
-
21
-
22
-
23
-
24
-
25
-
26
-
27
-
28
-
29
-
30
-
31
-
32
-
33
-
34
-
35
-
36
-
37
-
38
-
39
-
40
-
41
-
42
-
43
-
44
-
45
-
46
-
47
-
48
-
49
-
50
-
51
-
52
-
53
-
54
-
55
-
56
-
57
-
58
-
59
-
60
-
61
-
62
-
63
-
64
-
65
-
66
-
67
-
68
-
69
-
70
-
71
-
72
-
73
-
74
-
75
-
76
-
77
-
78
-
79
-
80
-
81
-
82
-
83
-
84
-
85
-
86
-
87
-
88
-
89
-
90
-
91
-
92
-
93
-
94
-
95
-
96
-
97
-
98
-
99
-
100
-
101
-
102
-
103
-
104
-
105
-
106
-
107
-
 108
108 -
 109
109 -
 110
110 -
 111
111 -
 112
112 -
 113
113 -
 114
114 -
 115
115 -
 116
116 -
 117
117 -
 118
118 -
 119
119 -
 120
120 -
 121
121 -
 122
122 -
 123
123 -
 124
124 -
 125
125 -
 126
126 -
 127
127 -
 128
128 -
129
-
130
-
131
-
132
-
133
-
134
-
135
-
136
-
137
-
138
-
139
-
140
-
141
-
142
-
143
-
144
-
145
-
146
-
147
-
148
-
149
-
150
-
151
-
152
-
153
-
154
-
155
-
156
-
157
-
158
-
159
-
160
-
161
-
162
-
163
-
164
-
165
-
166
-
167
-
168
-
169
-
170
-
171
-
172
-
173
-
174
-
175
-
176
-
177
-
178
-
179
-
180
-
181
-
182
-
183
-
184
-
185
-
186
-
187
-
188
-
189
-
190
-
191
-
192
-
193
-
194
-
195
-
196
-
197
-
198
-
199
-
200
-
201
-
202
-
203
-
204
-
205
-
206
-
207
 |
 |
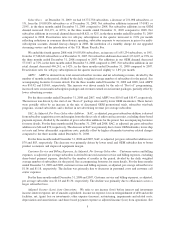
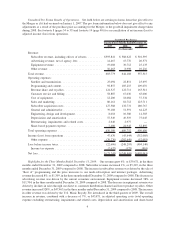
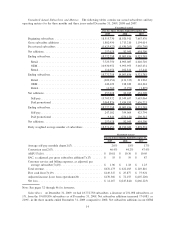
prices. Other revenue increased $142 in the year ended December 31, 2008 compared to 2007. This revenue growth
was driven by our 20% growth in average subscribers. This increase, combined with lower fixed costs, particularly
in the fourth quarter, resulted in improved adjusted loss from operations of ($136,298) in 2008 versus ($565,452) in
2007, as increases in our variable costs were more than offset by decreases in other operating expenses. Total
operating expenses, excluding restructuring, depreciation and share-based payment expense and a $27,500 one-
time Merger related payment to a programming provider, decreased by 3%, or $78,522, during 2008.
Satellite and transmission costs decreased 2%, or $2,536, in the year ended December 31, 2008 compared to
2007 due to reductions in repeater maintenance costs and personnel costs. Programming and content costs increased
11%, or $45,177, in the year ended December 31, 2008 compared to 2007, primarily due to a one-time payment to a
programming provider of $27,500 due upon completion of the Merger. Excluding this one-time payment,
programming costs increased by 4%, or $17,677. Revenue share and royalties increased by 19%, or $74,903,
in the year ended December 31, 2008 compared to 2007, maintaining a flat percentage of revenue of approximately
20% in 2008 and 2007. Customer service and billing costs increased 12%, or $26,793, in the year ended
December 31, 2008 compared to 2007 due to a larger subscriber base, mitigated by scale efficiencies. Cost of
equipment decreased by 32%, or $31,716, in the year ended December 31, 2008 compared to 2007 as a result of
lower product costs.
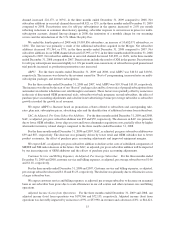
Sales and marketing costs decreased 17%, or $70,788, in the year ended December 31, 2008 compared to 2007
due to reduced advertising and cooperative marketing spend, offset in part by higher customer retention spending.
Subscriber acquisition costs declined nearly 12%, or $77,649, in the year ended December 31, 2008 compared to
2007. This improvement was primarily driven by a 14% improvement in SAC, as adjusted, per gross addition due to
improved product economics and lower retail and OEM subsidies. Subscriber acquisition costs also declined as a
result of the 5% decline in gross additions during 2008.
General and administrative costs decreased 2%, or $4,799, in the year ended December 31, 2008 compared to
2007, reflecting lower one-time costs in connection with the Merger and early integration savings in 2008.
Engineering, design and development costs decreased 17%, or $10,407, in the year ended December 31, 2008
compared to 2007 due to fewer OEM platform launches and lower product development costs.
Restructuring, impairments and related costs increased $10,434, in the year ended December 31, 2008
compared to 2007 due to restructuring charges associated with the Merger.
Other expenses increased by $159,815 or 72%, in the year ended December 31, 2008 compared to 2007 as a
result of higher interest expense and loss from redemption of debt during 2008.
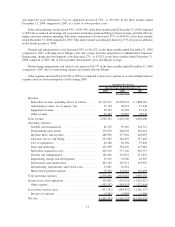
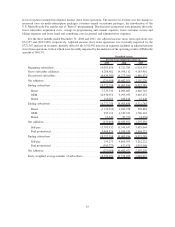
Unaudited Actual Information
Our discussion of our unaudited actual results of operations includes the following non-GAAP financial
measures: average self-pay monthly churn; conversion rate; average monthly revenue per subscriber, or ARPU;
subscriber acquisition cost, or SAC, as adjusted, per gross subscriber addition; customer service and billing
expenses, as adjusted, per average subscriber; free cash flow; and adjusted income (loss) from operations. We
believe these non-GAAP financial measures provide meaningful supplemental information regarding our operating
performance and are used for internal management purposes, when publicly providing the business outlook, and as
a means to evaluate period-to-period comparisons. Please refer to the footnotes (pages 32 through 46) following our
discussion of results of operations for the definitions and a further discussion of the usefulness of such non-GAAP
financial measures.
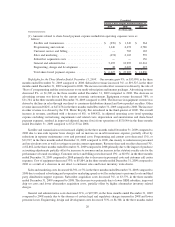
The discussion of our results of operations for the three months and three years ended December 31, 2009,
2008, and 2007 includes the financial results of XM from the date of the Merger. The inclusion of these results may
render direct comparisons with results for prior periods less meaningful. Accordingly, the discussion below
addresses trends we believe are significant.
13