XM Radio 2009 Annual Report Download - page 159
Download and view the complete annual report
Please find page 159 of the 2009 XM Radio annual report below. You can navigate through the pages in the report by either clicking on the pages listed below, or by using the keyword search tool below to find specific information within the annual report.-
 1
1 -
2
-
3
-
4
-
5
-
6
-
7
-
8
-
9
-
10
-
11
-
12
-
13
-
14
-
15
-
16
-
17
-
18
-
19
-
20
-
21
-
22
-
23
-
24
-
25
-
26
-
27
-
28
-
29
-
30
-
31
-
32
-
33
-
34
-
35
-
36
-
37
-
38
-
39
-
40
-
41
-
42
-
43
-
44
-
45
-
46
-
47
-
48
-
49
-
50
-
51
-
52
-
53
-
54
-
55
-
56
-
57
-
58
-
59
-
60
-
61
-
62
-
63
-
64
-
65
-
66
-
67
-
68
-
69
-
70
-
71
-
72
-
73
-
74
-
75
-
76
-
77
-
78
-
79
-
80
-
81
-
82
-
83
-
84
-
85
-
86
-
87
-
88
-
89
-
90
-
91
-
92
-
93
-
94
-
95
-
96
-
97
-
98
-
99
-
100
-
101
-
102
-
103
-
104
-
105
-
106
-
107
-
108
-
109
-
110
-
111
-
112
-
113
-
114
-
115
-
116
-
117
-
118
-
119
-
120
-
121
-
122
-
123
-
124
-
125
-
126
-
127
-
128
-
129
-
130
-
131
-
132
-
133
-
134
-
135
-
136
-
137
-
138
-
139
-
140
-
141
-
142
-
143
-
144
-
145
-
146
-
147
-
148
-
 149
149 -
 150
150 -
 151
151 -
 152
152 -
 153
153 -
 154
154 -
 155
155 -
 156
156 -
 157
157 -
 158
158 -
 159
159 -
 160
160 -
 161
161 -
 162
162 -
 163
163 -
 164
164 -
 165
165 -
 166
166 -
 167
167 -
 168
168 -
 169
169 -
170
-
171
-
172
-
173
-
174
-
175
-
176
-
177
-
178
-
179
-
180
-
181
-
182
-
183
-
184
-
185
-
186
-
187
-
188
-
189
-
190
-
191
-
192
-
193
-
194
-
195
-
196
-
197
-
198
-
199
-
200
-
201
-
202
-
203
-
204
-
205
-
206
-
207
 |
 |

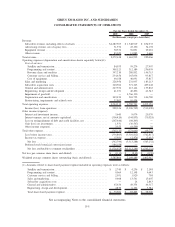
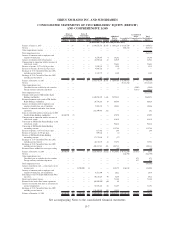
SIRIUS XM RADIO INC. AND SUBSIDIARIES
CONSOLIDATED STATEMENTS OF OPERATIONS
2009 2008 2007
For the Years Ended December 31,
(In thousands, except per share data)
Revenue:
Subscriber revenue, including effects of rebates . . . . . . . . . . . . . . . . . . . . . $2,287,503 $ 1,548,919 $ 854,933
Advertising revenue, net of agency fees . . . . . . . . . . . . . . . . . . . . . . . . . . . 51,754 47,190 34,192
Equipment revenue . . . . . . . . . . . . . . . . . . . . . . . . . . . . . . . . . . . . . . . . . 50,352 56,001 29,281
Other revenue . . . . . . . . . . . . . . . . . . . . . . . . . . . . . . . . . . . . . . . . . . . . . 83,029 11,882 3,660
Total revenue . . . . . . . . . . . . . . . . . . . . . . . . . . . . . . . . . . . . . . . . . . . . . . . 2,472,638 1,663,992 922,066
Operating expenses (depreciation and amortization shown separately below)(1):
Cost of services:
Satellite and transmission . . . . . . . . . . . . . . . . . . . . . . . . . . . . . . . . . . . 84,033 59,279 27,907
Programming and content . . . . . . . . . . . . . . . . . . . . . . . . . . . . . . . . . . . 308,121 312,189 236,059
Revenue share and royalties . . . . . . . . . . . . . . . . . . . . . . . . . . . . . . . . . 397,210 280,852 146,715
Customer service and billing . . . . . . . . . . . . . . . . . . . . . . . . . . . . . . . . . 234,456 165,036 93,817
Cost of equipment . . . . . . . . . . . . . . . . . . . . . . . . . . . . . . . . . . . . . . . . 40,188 46,091 35,817
Sales and marketing . . . . . . . . . . . . . . . . . . . . . . . . . . . . . . . . . . . . . . . . 228,956 231,937 183,213
Subscriber acquisition costs . . . . . . . . . . . . . . . . . . . . . . . . . . . . . . . . . . . 340,506 371,343 407,642
General and administrative . . . . . . . . . . . . . . . . . . . . . . . . . . . . . . . . . . . . 227,554 213,142 155,863
Engineering, design and development . . . . . . . . . . . . . . . . . . . . . . . . . . . . 41,031 40,496 41,343
Impairment of goodwill . . . . . . . . . . . . . . . . . . . . . . . . . . . . . . . . . . . . . . — 4,766,190 —
Depreciation and amortization . . . . . . . . . . . . . . . . . . . . . . . . . . . . . . . . . 309,450 203,752 106,780
Restructuring, impairments and related costs . . . . . . . . . . . . . . . . . . . . . . . 32,807 10,434 —
Total operating expenses . . . . . . . . . . . . . . . . . . . . . . . . . . . . . . . . . . . . . . . 2,244,312 6,700,741 1,435,156
Income (loss) from operations . . . . . . . . . . . . . . . . . . . . . . . . . . . . . . . . . 228,326 (5,036,749) (513,090)
Other income (expense):
Interest and investment income . . . . . . . . . . . . . . . . . . . . . . . . . . . . . . . . . 3,645 9,079 20,570
Interest expense, net of amounts capitalized . . . . . . . . . . . . . . . . . . . . . . . . (306,420) (144,833) (70,328)
Loss on extinguishment of debt and credit facilities, net . . . . . . . . . . . . . . . (267,646) (98,203) —
Gain (loss) on investments . . . . . . . . . . . . . . . . . . . . . . . . . . . . . . . . . . . . 1,931 (30,507) —
Other income (expense) . . . . . . . . . . . . . . . . . . . . . . . . . . . . . . . . . . . . . . 3,355 (9,599) 31
Total other expense. . . . . . . . . . . . . . . . . . . . . . . . . . . . . . . . . . . . . . . . . . . (565,135) (274,063) (49,727)
Loss before income taxes . . . . . . . . . . . . . . . . . . . . . . . . . . . . . . . . . . . . . (336,809) (5,310,812) (562,817)
Income tax expense . . . . . . . . . . . . . . . . . . . . . . . . . . . . . . . . . . . . . . . . . (5,981) (2,476) (2,435)
Net loss . . . . . . . . . . . . . . . . . . . . . . . . . . . . . . . . . . . . . . . . . . . . . . . (342,790) (5,313,288) (565,252)
Preferred stock beneficial conversion feature . . . . . . . . . . . . . . . . . . . . . . . (186,188) — —
Net loss attributable to common stockholders . . . . . . . . . . . . . . . . . . . . . $ (528,978) $(5,313,288) $ (565,252)
Net loss per common share (basic and diluted) . . . . . . . . . . . . . . . . . . . . . . . $ (0.15) $ (2.45) $ (0.39)
Weighted average common shares outstanding (basic and diluted) . . . . . . . . . . 3,585,864 2,169,489 1,462,967
(1) Amounts related to share-based payment expense included in operating expenses were as follows:
Satellite and transmission . . . . . . . . . . . . . . . . . . . . . . . . . . . . . . . . . . . $ 2,745 $ 4,236 $ 2,198
Programming and content . . . . . . . . . . . . . . . . . . . . . . . . . . . . . . . . . . . 9,064 12,148 9,643
Customer service and billing . . . . . . . . . . . . . . . . . . . . . . . . . . . . . . . . . 2,051 1,920 708
Sales and marketing . . . . . . . . . . . . . . . . . . . . . . . . . . . . . . . . . . . . . . . 9,608 13,541 15,607
Subscriber acquisition costs . . . . . . . . . . . . . . . . . . . . . . . . . . . . . . . . . — 14 2,843
General and administrative . . . . . . . . . . . . . . . . . . . . . . . . . . . . . . . . . . 45,634 49,354 44,317
Engineering, design and development. . . . . . . . . . . . . . . . . . . . . . . . . . . 4,879 6,192 3,584
Total share-based payment expense . . . . . . . . . . . . . . . . . . . . . . . . . . . . $ 73,981 $ 87,405 $ 78,900
See accompanying Notes to the consolidated financial statements.
F-5