XM Radio 2009 Annual Report Download - page 132
Download and view the complete annual report
Please find page 132 of the 2009 XM Radio annual report below. You can navigate through the pages in the report by either clicking on the pages listed below, or by using the keyword search tool below to find specific information within the annual report.-
 1
1 -
2
-
3
-
4
-
5
-
6
-
7
-
8
-
9
-
10
-
11
-
12
-
13
-
14
-
15
-
16
-
17
-
18
-
19
-
20
-
21
-
22
-
23
-
24
-
25
-
26
-
27
-
28
-
29
-
30
-
31
-
32
-
33
-
34
-
35
-
36
-
37
-
38
-
39
-
40
-
41
-
42
-
43
-
44
-
45
-
46
-
47
-
48
-
49
-
50
-
51
-
52
-
53
-
54
-
55
-
56
-
57
-
58
-
59
-
60
-
61
-
62
-
63
-
64
-
65
-
66
-
67
-
68
-
69
-
70
-
71
-
72
-
73
-
74
-
75
-
76
-
77
-
78
-
79
-
80
-
81
-
82
-
83
-
84
-
85
-
86
-
87
-
88
-
89
-
90
-
91
-
92
-
93
-
94
-
95
-
96
-
97
-
98
-
99
-
100
-
101
-
102
-
103
-
104
-
105
-
106
-
107
-
108
-
109
-
110
-
111
-
112
-
113
-
114
-
115
-
116
-
117
-
118
-
119
-
120
-
121
-
 122
122 -
 123
123 -
 124
124 -
 125
125 -
 126
126 -
 127
127 -
 128
128 -
 129
129 -
 130
130 -
 131
131 -
 132
132 -
 133
133 -
 134
134 -
 135
135 -
 136
136 -
 137
137 -
 138
138 -
 139
139 -
 140
140 -
 141
141 -
 142
142 -
143
-
144
-
145
-
146
-
147
-
148
-
149
-
150
-
151
-
152
-
153
-
154
-
155
-
156
-
157
-
158
-
159
-
160
-
161
-
162
-
163
-
164
-
165
-
166
-
167
-
168
-
169
-
170
-
171
-
172
-
173
-
174
-
175
-
176
-
177
-
178
-
179
-
180
-
181
-
182
-
183
-
184
-
185
-
186
-
187
-
188
-
189
-
190
-
191
-
192
-
193
-
194
-
195
-
196
-
197
-
198
-
199
-
200
-
201
-
202
-
203
-
204
-
205
-
206
-
207
 |
 |

Gain (loss) on investments. Gain (loss) on investments includes our share of SIRIUS Canada’s and XM
Canada’s net losses, and losses recorded from our investment in XM Canada when the fair value was determined to
be other than temporary.
•2009 vs. 2008: For the years ended December 31, 2009 and 2008, gain (loss) on investment was $1,931 and
($30,507), respectively. The decrease in the loss was attributable to payments received from SIRIUS Canada
in excess of our carrying value of our investments, decreases in our share of SIRIUS Canada’s and XM
Canada’s net losses and decreases in impairment charges related to our investment in XM Canada for the
year ended December 31, 2009 compared to 2008.
•2008 vs. 2007: For the years ended December 31, 2008 and 2007, loss on investment was $30,507 and $0,
respectively.
Income Taxes
Income Tax Expense. Income tax expense represents the recognition of a deferred tax liability related to the
difference in accounting for our FCC licenses, which are amortized over 15 years for tax purposes but not amortized
for book purposes in accordance with GAAP.
•2009 vs. 2008: We recorded income tax expense of $5,981 and $2,476 for the years ended December 31,
2009 and 2008, respectively. The increase was attributed to the inclusion of XM.
•2008 vs. 2007: We recorded income tax expense of $2,476 and $2,435 for the years ended December 31,
2008 and 2007, respectively.
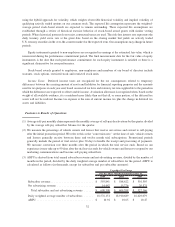
Liquidity and Capital Resources
Cash Flows for the Year Ended December 31, 2009 Compared with Year Ended December 31, 2008 and
Year Ended December 31, 2008 Compared with Year Ended December 31, 2007
As of December 31, 2009 and 2008, we had $383,489 and $380,446, respectively, in cash and cash equivalents.
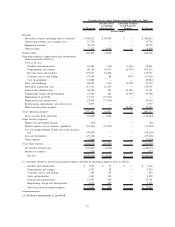
The following table presents a summary of our cash flow activity for the periods set forth below (in thousands):
2009 2008 2007 2009 vs. 2008 2008 vs. 2007
For the Years Ended December 31,
Net cash provided by (used in)
operating activities ........ $433,830 $(152,797) $(148,766) $ 586,627 $ (4,031)
Net cash (used in) provided by
investing activities ........ (248,511) 728,425 (54,186) (976,936) 782,611
Net cash (used in) provided by
financing activities ........ (182,276) (634,002) 248,351 451,726 (882,353)
Net increase (decrease) in cash
and cash equivalents ....... 3,043 (58,374) 45,399 61,417 (103,773)
Cash and cash equivalents at
beginning of period ....... 380,446 438,820 393,421 (58,374) 45,399
Cash and cash equivalents at
end of period ............ $383,489 $ 380,446 $ 438,820 $ 3,043 $ (58,374)
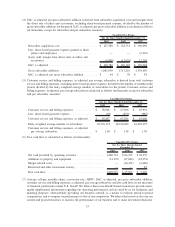
Cash Flows Provided by (Used in) Operating Activities
•2009 vs. 2008: Net cash provided by operating activities increased $586,627 to $433,830 for the year
ended December 31, 2009 from net cash used in operating activities of $152,797 for the year ended
December 31, 2008. The increase was primarily the result of a decreased net loss, net of non-cash operating
activities of $388,435, and an increase in cash provided by working capital of $198,192.
•2008 vs. 2007: Net cash used in operating activities increased $4,031 to $152,797 for the year ended
December 31, 2008 from $148,766 for the year ended December 31, 2007. The increase was primarily the
27