XM Radio 2009 Annual Report Download - page 153
Download and view the complete annual report
Please find page 153 of the 2009 XM Radio annual report below. You can navigate through the pages in the report by either clicking on the pages listed below, or by using the keyword search tool below to find specific information within the annual report.-
 1
1 -
2
-
3
-
4
-
5
-
6
-
7
-
8
-
9
-
10
-
11
-
12
-
13
-
14
-
15
-
16
-
17
-
18
-
19
-
20
-
21
-
22
-
23
-
24
-
25
-
26
-
27
-
28
-
29
-
30
-
31
-
32
-
33
-
34
-
35
-
36
-
37
-
38
-
39
-
40
-
41
-
42
-
43
-
44
-
45
-
46
-
47
-
48
-
49
-
50
-
51
-
52
-
53
-
54
-
55
-
56
-
57
-
58
-
59
-
60
-
61
-
62
-
63
-
64
-
65
-
66
-
67
-
68
-
69
-
70
-
71
-
72
-
73
-
74
-
75
-
76
-
77
-
78
-
79
-
80
-
81
-
82
-
83
-
84
-
85
-
86
-
87
-
88
-
89
-
90
-
91
-
92
-
93
-
94
-
95
-
96
-
97
-
98
-
99
-
100
-
101
-
102
-
103
-
104
-
105
-
106
-
107
-
108
-
109
-
110
-
111
-
112
-
113
-
114
-
115
-
116
-
117
-
118
-
119
-
120
-
121
-
122
-
123
-
124
-
125
-
126
-
127
-
128
-
129
-
130
-
131
-
132
-
133
-
134
-
135
-
136
-
137
-
138
-
139
-
140
-
141
-
142
-
 143
143 -
 144
144 -
 145
145 -
 146
146 -
 147
147 -
 148
148 -
 149
149 -
 150
150 -
 151
151 -
 152
152 -
 153
153 -
 154
154 -
 155
155 -
 156
156 -
 157
157 -
 158
158 -
 159
159 -
 160
160 -
 161
161 -
 162
162 -
 163
163 -
164
-
165
-
166
-
167
-
168
-
169
-
170
-
171
-
172
-
173
-
174
-
175
-
176
-
177
-
178
-
179
-
180
-
181
-
182
-
183
-
184
-
185
-
186
-
187
-
188
-
189
-
190
-
191
-
192
-
193
-
194
-
195
-
196
-
197
-
198
-
199
-
200
-
201
-
202
-
203
-
204
-
205
-
206
-
207
 |
 |
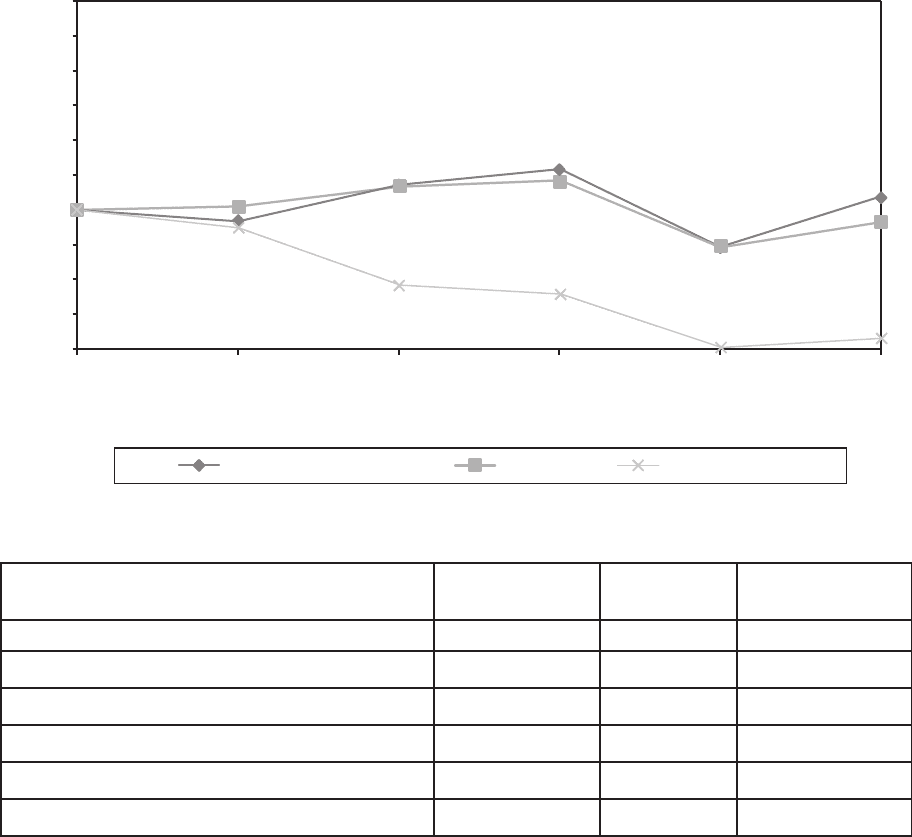
Comparison of Cumulative Total Returns
Set forth below is a graph comparing the cumulative performance of our common stock with the Standard &
Poor’s Composite-500 Stock Index, or the S&P 500, and the NASDAQ Telecommunications Index from
December 31, 2004 to December 31, 2009. The graph assumes that $100 was invested on December 31, 2004
in each of our common stock, the S&P 500 and the NASDAQ Telecommunications Index and that all dividends
were reinvested.
0
25
50
75
100
125
150
175
200
225
250
Dec-09Dec-04 Dec-05 Dec-06
YEAR
Dec-07 Dec-08
DOLLARS
S&P 500 Index
Nasdaq Telecommunications Index Sirius XM Radio Inc.
Stockholder Return Performance Table
Nasdaq
Telecommunications
Index S&P 500 Index Sirius XM Radio Inc.
December 31, 2004 $100.00 $100.00 $100.00
December 31, 2005 $ 92.79 $103.00 $ 87.93
December 31, 2006 $118.55 $117.03 $ 46.46
December 31, 2007 $129.42 $121.16 $ 39.76
December 31, 2008 $ 73.79 $ 74.53 $ 1.57
December 31, 2009 $109.39 $ 92.01 $ 7.87
48