XM Radio 2009 Annual Report Download - page 121
Download and view the complete annual report
Please find page 121 of the 2009 XM Radio annual report below. You can navigate through the pages in the report by either clicking on the pages listed below, or by using the keyword search tool below to find specific information within the annual report.-
 1
1 -
2
-
3
-
4
-
5
-
6
-
7
-
8
-
9
-
10
-
11
-
12
-
13
-
14
-
15
-
16
-
17
-
18
-
19
-
20
-
21
-
22
-
23
-
24
-
25
-
26
-
27
-
28
-
29
-
30
-
31
-
32
-
33
-
34
-
35
-
36
-
37
-
38
-
39
-
40
-
41
-
42
-
43
-
44
-
45
-
46
-
47
-
48
-
49
-
50
-
51
-
52
-
53
-
54
-
55
-
56
-
57
-
58
-
59
-
60
-
61
-
62
-
63
-
64
-
65
-
66
-
67
-
68
-
69
-
70
-
71
-
72
-
73
-
74
-
75
-
76
-
77
-
78
-
79
-
80
-
81
-
82
-
83
-
84
-
85
-
86
-
87
-
88
-
89
-
90
-
91
-
92
-
93
-
94
-
95
-
96
-
97
-
98
-
99
-
100
-
101
-
102
-
103
-
104
-
105
-
106
-
107
-
108
-
109
-
110
-
 111
111 -
 112
112 -
 113
113 -
 114
114 -
 115
115 -
 116
116 -
 117
117 -
 118
118 -
 119
119 -
 120
120 -
 121
121 -
 122
122 -
 123
123 -
 124
124 -
 125
125 -
 126
126 -
 127
127 -
 128
128 -
 129
129 -
 130
130 -
 131
131 -
132
-
133
-
134
-
135
-
136
-
137
-
138
-
139
-
140
-
141
-
142
-
143
-
144
-
145
-
146
-
147
-
148
-
149
-
150
-
151
-
152
-
153
-
154
-
155
-
156
-
157
-
158
-
159
-
160
-
161
-
162
-
163
-
164
-
165
-
166
-
167
-
168
-
169
-
170
-
171
-
172
-
173
-
174
-
175
-
176
-
177
-
178
-
179
-
180
-
181
-
182
-
183
-
184
-
185
-
186
-
187
-
188
-
189
-
190
-
191
-
192
-
193
-
194
-
195
-
196
-
197
-
198
-
199
-
200
-
201
-
202
-
203
-
204
-
205
-
206
-
207
 |
 |

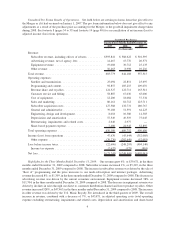
in total expenses included in adjusted income (loss) from operations. The increase in revenue was due mainly to
increased rates on multi-subscription packages, revenues earned on internet packages, the introduction of the
U.S. Music Royalty Fee and the sale of “Best of” programming. The decreases in expenses were primarily driven by
lower subscriber acquisition costs, savings in programming and content expenses, lower customer service and
billing expenses and lower legal and consulting costs in general and administrative expenses.
For the three months ended December 31, 2008 and 2007, our adjusted income (loss) from operations was
$72,155 and ($107,220), respectively. Adjusted income (loss) from operations was favorably impacted by the
$372,367 increase in revenues, partially offset by the $192,992 increase in expenses included in adjusted income
(loss) from operations, both of which were favorably impacted by the inclusion of the operating results of XM in the
amount of $60,371.
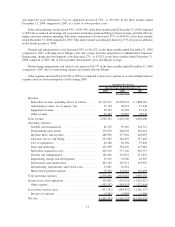
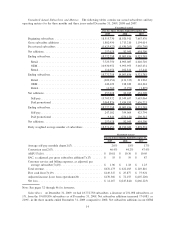
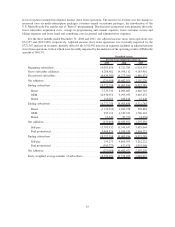
2009 2008 2007
For the Years Ended December 31,
Unaudited Actual
Beginning subscribers ............................ 19,003,856 8,321,785 6,024,555
Gross subscriber additions. . ....................... 6,208,482 14,954,112 4,183,901
Deactivated subscribers ........................... (6,439,580) (4,272,041) (1,886,671)
Net additions .................................. (231,098) 10,682,071 2,297,230
Ending subscribers .............................. 18,772,758 19,003,856 8,321,785
Retail ...................................... 7,725,750 8,905,087 4,640,710
OEM ...................................... 10,930,952 9,995,953 3,665,631
Rental ..................................... 116,056 102,816 15,444
Ending subscribers .............................. 18,772,758 19,003,856 8,321,785
Retail ...................................... (1,179,452) 4,264,378 598,884
OEM ...................................... 935,114 6,330,321 1,706,622
Rental ..................................... 13,240 87,372 (8,276)
Net additions .................................. (231,098) 10,682,071 2,297,230
Self-pay .................................... 15,703,932 15,549,657 5,685,064
Paid promotional.............................. 3,068,826 3,454,199 2,636,721
Ending subscribers .............................. 18,772,758 19,003,856 8,321,785
Self-pay .................................... 154,275 9,864,593 1,262,222
Paid promotional.............................. (385,373) 817,478 1,035,008
Net additions .................................. (231,098) 10,682,071 2,297,230
Daily weighted average number of subscribers.......... 18,529,696 13,378,035 7,082,927
16