XM Radio 2009 Annual Report Download - page 128
Download and view the complete annual report
Please find page 128 of the 2009 XM Radio annual report below. You can navigate through the pages in the report by either clicking on the pages listed below, or by using the keyword search tool below to find specific information within the annual report.-
 1
1 -
2
-
3
-
4
-
5
-
6
-
7
-
8
-
9
-
10
-
11
-
12
-
13
-
14
-
15
-
16
-
17
-
18
-
19
-
20
-
21
-
22
-
23
-
24
-
25
-
26
-
27
-
28
-
29
-
30
-
31
-
32
-
33
-
34
-
35
-
36
-
37
-
38
-
39
-
40
-
41
-
42
-
43
-
44
-
45
-
46
-
47
-
48
-
49
-
50
-
51
-
52
-
53
-
54
-
55
-
56
-
57
-
58
-
59
-
60
-
61
-
62
-
63
-
64
-
65
-
66
-
67
-
68
-
69
-
70
-
71
-
72
-
73
-
74
-
75
-
76
-
77
-
78
-
79
-
80
-
81
-
82
-
83
-
84
-
85
-
86
-
87
-
88
-
89
-
90
-
91
-
92
-
93
-
94
-
95
-
96
-
97
-
98
-
99
-
100
-
101
-
102
-
103
-
104
-
105
-
106
-
107
-
108
-
109
-
110
-
111
-
112
-
113
-
114
-
115
-
116
-
117
-
 118
118 -
 119
119 -
 120
120 -
 121
121 -
 122
122 -
 123
123 -
 124
124 -
 125
125 -
 126
126 -
 127
127 -
 128
128 -
 129
129 -
 130
130 -
 131
131 -
 132
132 -
 133
133 -
 134
134 -
 135
135 -
 136
136 -
 137
137 -
 138
138 -
139
-
140
-
141
-
142
-
143
-
144
-
145
-
146
-
147
-
148
-
149
-
150
-
151
-
152
-
153
-
154
-
155
-
156
-
157
-
158
-
159
-
160
-
161
-
162
-
163
-
164
-
165
-
166
-
167
-
168
-
169
-
170
-
171
-
172
-
173
-
174
-
175
-
176
-
177
-
178
-
179
-
180
-
181
-
182
-
183
-
184
-
185
-
186
-
187
-
188
-
189
-
190
-
191
-
192
-
193
-
194
-
195
-
196
-
197
-
198
-
199
-
200
-
201
-
202
-
203
-
204
-
205
-
206
-
207
 |
 |
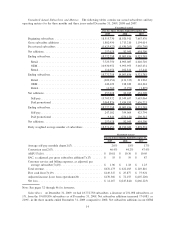
•2009 vs. 2008: For the years ended December 31, 2009 and 2008, other revenue was $83,029 and $11,882,
respectively, which represents an increase of 599%, or $71,147. The increase was primarily due to the
introduction of the U.S. Music Royalty Fee and the inclusion of XM revenue for a full year.
•2008 vs. 2007: For the years ended December 31, 2008 and 2007, other revenue was $11,882 and $3,660,
respectively, which represents an increase of 225%, or $8,222. The increase was primarily due to the Merger
and was partially offset by decreased content licensing fees.
We expect other revenue to increase with a full year of billing of the U.S. Music Royalty Fee and as revenues
from affiliates increase.
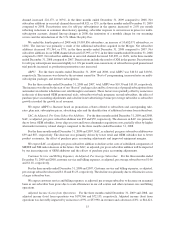
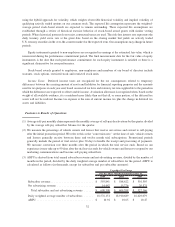
Operating Expenses
Satellite and Transmission. Satellite and transmission expenses consist of costs associated with the operation
and maintenance of our satellites; satellite telemetry, tracking and control system; terrestrial repeater network;
satellite uplink facility; and broadcast studios.
•2009 vs. 2008: For the years ended December 31, 2009 and 2008, satellite and transmission expenses were
$84,033 and $59,279, respectively, which represents an increase of 42%, or $24,754. The satellite and
transmission increase was primarily due to the inclusion of XM’s satellite and transmission expense,
partially offset by decreases due to the elimination of contracts, decommissioned repeater sites and decrease
in streaming costs.
•2008 vs. 2007: For the years ended December 31, 2008 and 2007, satellite and transmission expenses were
$59,279 and $27,907, respectively, which represents an increase of 112%, or $31,372 primarily due to the
Merger. XM satellite and transmission expense accounted for $29,852 during the year ended December 31,
2008.
We expect satellite and transmission expenses, excluding share-based payment expense, to increase as we add
to our in-orbit satellite fleet.
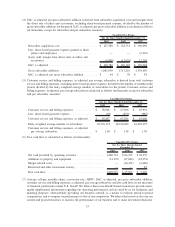
Programming and Content. Programming and content expenses include costs to acquire, create and produce
content and on-air talent costs. We have entered into various agreements with third parties for music and non-music
programming that require us to pay license fees, share advertising revenue, purchase advertising on media
properties owned or controlled by the licensor and pay other guaranteed amounts. Purchased advertising is
recorded as a sales and marketing expense and the cost of sharing advertising revenue is recorded as revenue share
and royalties in the period the advertising is broadcast.
•2009 vs. 2008: For the years ended December 31, 2009 and 2008, programming and content expenses were
$308,121 and $312,189, respectively, which represents a decrease of $4,068, or 1%. The increase from the
inclusion of a full year of XM expense was offset by savings in content agreements, personnel and on-air
talent costs.
•2008 vs. 2007: For the years ended December 31, 2008 and 2007, programming and content expenses were
$312,189 and $236,059, respectively, which represents an increase of 32%, or $76,130 primarily due to the
Merger.
Our programming and content expenses, excluding share-based payment expense, are expected to decrease as
we reduce duplicate programming and content costs.
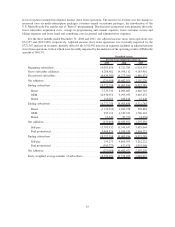
Revenue Share and Royalties. Revenue share and royalties include distribution and content provider revenue
share, residuals and broadcast and web streaming royalties. Residuals are monthly fees paid based upon the number
of subscribers using SIRIUS and XM radios purchased from retailers. Advertising revenue share is recorded to
revenue share and royalties in the period the advertising is broadcast.
•2009 vs. 2008: For the years ended December 31, 2009 and 2008, revenue share and royalties were
$397,210 and $280,852, respectively, which represents an increase of 41%, or $116,358. The increase was
primarily attributable to the inclusion of XM’s revenue share and royalty expense as a result of the Merger,
23