XM Radio 2009 Annual Report Download - page 142
Download and view the complete annual report
Please find page 142 of the 2009 XM Radio annual report below. You can navigate through the pages in the report by either clicking on the pages listed below, or by using the keyword search tool below to find specific information within the annual report.-
 1
1 -
2
-
3
-
4
-
5
-
6
-
7
-
8
-
9
-
10
-
11
-
12
-
13
-
14
-
15
-
16
-
17
-
18
-
19
-
20
-
21
-
22
-
23
-
24
-
25
-
26
-
27
-
28
-
29
-
30
-
31
-
32
-
33
-
34
-
35
-
36
-
37
-
38
-
39
-
40
-
41
-
42
-
43
-
44
-
45
-
46
-
47
-
48
-
49
-
50
-
51
-
52
-
53
-
54
-
55
-
56
-
57
-
58
-
59
-
60
-
61
-
62
-
63
-
64
-
65
-
66
-
67
-
68
-
69
-
70
-
71
-
72
-
73
-
74
-
75
-
76
-
77
-
78
-
79
-
80
-
81
-
82
-
83
-
84
-
85
-
86
-
87
-
88
-
89
-
90
-
91
-
92
-
93
-
94
-
95
-
96
-
97
-
98
-
99
-
100
-
101
-
102
-
103
-
104
-
105
-
106
-
107
-
108
-
109
-
110
-
111
-
112
-
113
-
114
-
115
-
116
-
117
-
118
-
119
-
120
-
121
-
122
-
123
-
124
-
125
-
126
-
127
-
128
-
129
-
130
-
131
-
 132
132 -
 133
133 -
 134
134 -
 135
135 -
 136
136 -
 137
137 -
 138
138 -
 139
139 -
 140
140 -
 141
141 -
 142
142 -
 143
143 -
 144
144 -
 145
145 -
 146
146 -
 147
147 -
 148
148 -
 149
149 -
 150
150 -
 151
151 -
 152
152 -
153
-
154
-
155
-
156
-
157
-
158
-
159
-
160
-
161
-
162
-
163
-
164
-
165
-
166
-
167
-
168
-
169
-
170
-
171
-
172
-
173
-
174
-
175
-
176
-
177
-
178
-
179
-
180
-
181
-
182
-
183
-
184
-
185
-
186
-
187
-
188
-
189
-
190
-
191
-
192
-
193
-
194
-
195
-
196
-
197
-
198
-
199
-
200
-
201
-
202
-
203
-
204
-
205
-
206
-
207
 |
 |

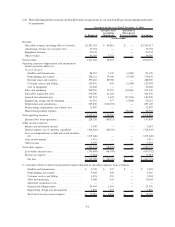
As Reported
Purchase Price
Accounting
Adjustments(a)
Allocation of Share-
based Payment
Expense Pro Forma
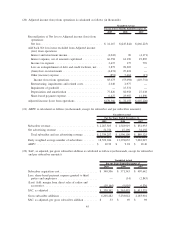
Unaudited for the Three Months Ended December 31, 2008
(In thousands)
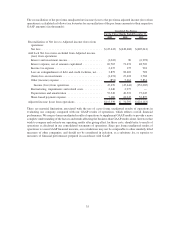
Revenue:
Subscriber revenue, including effects of rebates . . . . $ 568,523 $ 20,099 $ — $ 588,622
Advertising revenue, net of agency fees . . . . . . . . . 15,776 — — 15,776
Equipment revenue . . . . . . . . . . . . . . . . . . . . . . . 30,712 — — 30,712
Other revenue . . . . . . . . . . . . . . . . . . . . . . . . . . . 7,172 1,826 — 8,998
Total revenue . . . . . . . . . . . . . . . . . . . . . . . . . . . . . 622,183 21,925 — 644,108
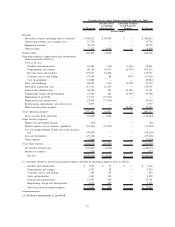
Operating expenses (depreciation and amortization
shown separately below)(1)
Cost of services:
Satellite and transmission . . . . . . . . . . . . . . . . . 24,481 (214) (1,416) 22,851
Programming and content . . . . . . . . . . . . . . . . . 89,214 20,755 (4,754) 105,215
Revenue share and royalties. . . . . . . . . . . . . . . . 103,217 19,494 — 122,711
Customer service and billing . . . . . . . . . . . . . . . 67,818 88 (870) 67,036
Cost of equipment . . . . . . . . . . . . . . . . . . . . . . 18,084 — — 18,084
Sales and marketing . . . . . . . . . . . . . . . . . . . . . . . 80,699 3,312 (2,299) 81,712
Subscriber acquisition costs . . . . . . . . . . . . . . . . . 113,512 19,219 — 132,731
General and administrative . . . . . . . . . . . . . . . . . . 64,586 306 (13,301) 51,591
Engineering, design and development. . . . . . . . . . . 12,404 281 (2,305) 10,380
Impairment of goodwill . . . . . . . . . . . . . . . . . . . . 15,331 (15,331) — —
Depreciation and amortization . . . . . . . . . . . . . . . . 82,958 (33,439) — 49,519
Restructuring, impairments and related costs . . . . . . 2,977 — — 2,977
Share-based payment expense . . . . . . . . . . . . . . . . — — 24,945 24,945
Total operating expenses . . . . . . . . . . . . . . . . . . . . . 675,281 14,471 — 689,752
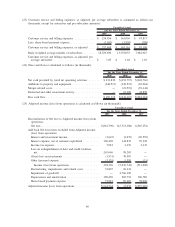
(Loss) income from operations . . . . . . . . . . . . . . . (53,098) 7,454 — (45,644)
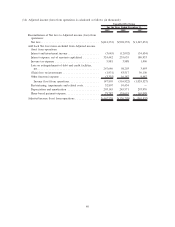
Other income (expense)
Interest and investment income . . . . . . . . . . . . . . . (90) — — (90)
Interest expense, net of amounts capitalized . . . . . . (61,196) (10,078) — (71,274)
Loss on extinguishment of debt and credit facilities,
net . . . . . . . . . . . . . . . . . . . . . . . . . . . . . . . . . (98,203) — — (98,203)
Loss on investments . . . . . . . . . . . . . . . . . . . . . . . (27,418) — — (27,418)
Other expense . . . . . . . . . . . . . . . . . . . . . . . . . . . (5,664) — — (5,664)
Total other expense . . . . . . . . . . . . . . . . . . . . . . . . . (192,571) (10,078) — (202,649)
Loss before income taxes . . . . . . . . . . . . . . . . . . . (245,669) (2,624) — (248,293)
Income tax expense . . . . . . . . . . . . . . . . . . . . . . . (175) — — (175)
Net loss . . . . . . . . . . . . . . . . . . . . . . . . . . . . . $(245,844) $ (2,624) $ — $(248,468)
(1) Amounts related to share-based payment expense included in operating expenses were as follows:
Satellite and transmission . . . . . . . . . . . . . . . . . $ 1,349 $ 67 $ — $ 1,416
Programming and content . . . . . . . . . . . . . . . . . 4,672 82 — 4,754
Customer service and billing . . . . . . . . . . . . . . . 783 87 — 870
Sales and marketing . . . . . . . . . . . . . . . . . . . . . 2,165 134 — 2,299
General and administrative . . . . . . . . . . . . . . . . 12,995 306 — 13,301
Engineering, design and development . . . . . . . . . 2,023 282 — 2,305
Total share-based payment expense . . . . . . . . . . $ 23,987 $ 958 $ — $ 24,945
(a) Includes impairment of goodwill.
37