XM Radio 2009 Annual Report Download - page 131
Download and view the complete annual report
Please find page 131 of the 2009 XM Radio annual report below. You can navigate through the pages in the report by either clicking on the pages listed below, or by using the keyword search tool below to find specific information within the annual report.-
 1
1 -
2
-
3
-
4
-
5
-
6
-
7
-
8
-
9
-
10
-
11
-
12
-
13
-
14
-
15
-
16
-
17
-
18
-
19
-
20
-
21
-
22
-
23
-
24
-
25
-
26
-
27
-
28
-
29
-
30
-
31
-
32
-
33
-
34
-
35
-
36
-
37
-
38
-
39
-
40
-
41
-
42
-
43
-
44
-
45
-
46
-
47
-
48
-
49
-
50
-
51
-
52
-
53
-
54
-
55
-
56
-
57
-
58
-
59
-
60
-
61
-
62
-
63
-
64
-
65
-
66
-
67
-
68
-
69
-
70
-
71
-
72
-
73
-
74
-
75
-
76
-
77
-
78
-
79
-
80
-
81
-
82
-
83
-
84
-
85
-
86
-
87
-
88
-
89
-
90
-
91
-
92
-
93
-
94
-
95
-
96
-
97
-
98
-
99
-
100
-
101
-
102
-
103
-
104
-
105
-
106
-
107
-
108
-
109
-
110
-
111
-
112
-
113
-
114
-
115
-
116
-
117
-
118
-
119
-
120
-
 121
121 -
 122
122 -
 123
123 -
 124
124 -
 125
125 -
 126
126 -
 127
127 -
 128
128 -
 129
129 -
 130
130 -
 131
131 -
 132
132 -
 133
133 -
 134
134 -
 135
135 -
 136
136 -
 137
137 -
 138
138 -
 139
139 -
 140
140 -
 141
141 -
142
-
143
-
144
-
145
-
146
-
147
-
148
-
149
-
150
-
151
-
152
-
153
-
154
-
155
-
156
-
157
-
158
-
159
-
160
-
161
-
162
-
163
-
164
-
165
-
166
-
167
-
168
-
169
-
170
-
171
-
172
-
173
-
174
-
175
-
176
-
177
-
178
-
179
-
180
-
181
-
182
-
183
-
184
-
185
-
186
-
187
-
188
-
189
-
190
-
191
-
192
-
193
-
194
-
195
-
196
-
197
-
198
-
199
-
200
-
201
-
202
-
203
-
204
-
205
-
206
-
207
 |
 |
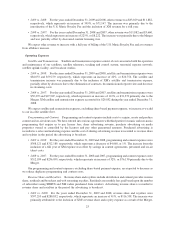
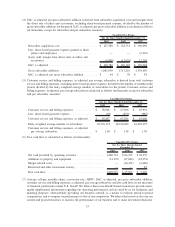
offset by lower costs associated with development, tooling and testing of radios as well as lower personnel
costs.
•2008 vs. 2007: For the years ended December 31, 2008 and 2007, engineering, design and development
expenses were $40,496 and $41,343, respectively, which represents a decrease of 2%, or $847. This decrease
was primarily due to reduced OEM and product development costs, offset partially by the impact of the
Merger.
We expect engineering, design and development expenses, excluding share-based payment expense, to
increase in future periods as we increase development of our next generation chip sets.
Other Income (Expense)
Interest and Investment Income. Interest and investment income includes realized gains and losses, dividends
and interest income, including amortization of the premium and discount arising at purchase.
•2009 vs. 2008: For the years ended December 31, 2009 and 2008, interest and investment income was
$3,645 and $9,079, respectively. The decrease of 60%, or $5,434, was primarily attributable to lower interest
rates in 2009 and a lower average cash balance.
•2008 vs. 2007: For the years ended December 31, 2008 and 2007, interest and investment income was
$9,079 and $20,570, respectively. The decrease of 56%, or $11,491 was primarily attributable to lower
interest rates in 2008 and a lower cash balance.
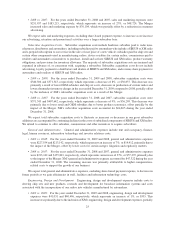
Interest Expense. Interest expense includes interest on outstanding debt, reduced by interest capitalized in
connection with the construction of our satellites and launch vehicles.
•2009 vs. 2008: For the years ended December 31, 2009 and 2008, interest expense was $306,420 and
$144,833, respectively, which represents an increase of 112%, or $161,587. Interest expense increased
significantly as a result of the Merger, due to additional debt and higher interest rates. Increases in interest
expense were partially offset by the capitalized interest associated with satellite construction and related
launch vehicles.
•2008 vs. 2007: For the years ended December 31, 2008 and 2007, interest expense was $144,833 and
$70,328, respectively, which represents an increase of 106%, or $74,505. Interest expense increased
significantly as a result of the Merger, due to additional debt and higher interest rates. Increases in interest
expense were partially offset by the capitalized interest associated with satellite construction and related
launch vehicle.
We expect interest expense to increase as a result of changes in the GAAP recognition and reporting
requirements for share lending arrangements which were adopted as of January 1, 2010. EITF No. 09-1, Accounting
for Own-Share Lending Arrangements in Contemplation of Convertible Debt Issuance, (“EITF No. 09-1”), will
require us to recognize an aggregate increase of $378,000 in deferred financing costs associated with XM’s 7%
Exchangeable Senior Subordinated Notes due 2014, which will be amortized to interest expense over the six year
life of the notes under the effective interest method.
Loss on Extinguishment of Debt and Credit Facilities, net. Loss on extinguishment of debt and credit
facilities, net, includes losses incurred as a result of the conversion and retirement of certain debt instruments.
•2009 vs. 2008: For the years ended December 31, 2009 and 2008, loss on extinguishment of debt and credit
facilities, net, was $267,646 and $98,203, respectively. During 2009, the loss was incurred on the retirement
of the SIRIUS’ Term Loan and Purchase Money Loan borrowings from Liberty Media, the repurchase of a
portion of XM Holdings’ 10% Convertible Senior Notes due 2009, and the retirement of XM’s Amended and
Restated Credit Agreement and XM’s Second-Lien Credit Agreement.
•2008 vs. 2007: For the year ended December 31, 2008 and 2007, loss from redemption of debt was $98,203
and $0, respectively.
26