XM Radio 2009 Annual Report Download - page 154
Download and view the complete annual report
Please find page 154 of the 2009 XM Radio annual report below. You can navigate through the pages in the report by either clicking on the pages listed below, or by using the keyword search tool below to find specific information within the annual report.-
 1
1 -
2
-
3
-
4
-
5
-
6
-
7
-
8
-
9
-
10
-
11
-
12
-
13
-
14
-
15
-
16
-
17
-
18
-
19
-
20
-
21
-
22
-
23
-
24
-
25
-
26
-
27
-
28
-
29
-
30
-
31
-
32
-
33
-
34
-
35
-
36
-
37
-
38
-
39
-
40
-
41
-
42
-
43
-
44
-
45
-
46
-
47
-
48
-
49
-
50
-
51
-
52
-
53
-
54
-
55
-
56
-
57
-
58
-
59
-
60
-
61
-
62
-
63
-
64
-
65
-
66
-
67
-
68
-
69
-
70
-
71
-
72
-
73
-
74
-
75
-
76
-
77
-
78
-
79
-
80
-
81
-
82
-
83
-
84
-
85
-
86
-
87
-
88
-
89
-
90
-
91
-
92
-
93
-
94
-
95
-
96
-
97
-
98
-
99
-
100
-
101
-
102
-
103
-
104
-
105
-
106
-
107
-
108
-
109
-
110
-
111
-
112
-
113
-
114
-
115
-
116
-
117
-
118
-
119
-
120
-
121
-
122
-
123
-
124
-
125
-
126
-
127
-
128
-
129
-
130
-
131
-
132
-
133
-
134
-
135
-
136
-
137
-
138
-
139
-
140
-
141
-
142
-
143
-
 144
144 -
 145
145 -
 146
146 -
 147
147 -
 148
148 -
 149
149 -
 150
150 -
 151
151 -
 152
152 -
 153
153 -
 154
154 -
 155
155 -
 156
156 -
 157
157 -
 158
158 -
 159
159 -
 160
160 -
 161
161 -
 162
162 -
 163
163 -
 164
164 -
165
-
166
-
167
-
168
-
169
-
170
-
171
-
172
-
173
-
174
-
175
-
176
-
177
-
178
-
179
-
180
-
181
-
182
-
183
-
184
-
185
-
186
-
187
-
188
-
189
-
190
-
191
-
192
-
193
-
194
-
195
-
196
-
197
-
198
-
199
-
200
-
201
-
202
-
203
-
204
-
205
-
206
-
207
 |
 |

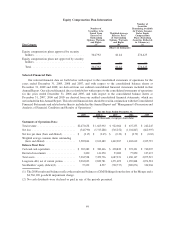
Equity Compensation Plan Information
Plan Category
Number of
Securities to be
Issued Upon
Exercise of
Outstanding
Options, Warrants
and Rights
(a)
Weighted-Average
Exercise Price
of Outstanding
Options, Warrants
and Rights
(b)
Number of
Securities
Remaining Available
for Future Issuance
Under Equity
Compensation
Plans (Excluding
Securities Reflected
in Column (a))
(c)
(Shares in thousands)
Equity compensation plans approved by security
holders ................................ 364,792 $1.44 274,425
Equity compensation plans not approved by security
holders ................................ — — —
Total.................................. 364,792 $1.44 274,425
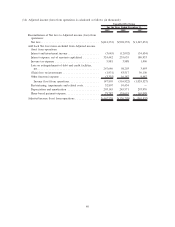
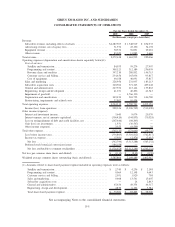
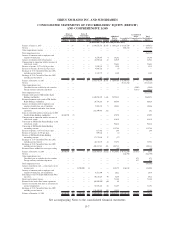
Selected Financial Data
Our selected financial data set forth below with respect to the consolidated statements of operations for the
years ended December 31, 2009, 2008 and 2007, and with respect to the consolidated balance sheets at
December 31, 2009 and 2008, are derived from our audited consolidated financial statements included in this
Annual Report. Our selected financial data set forth below with respect to the consolidated statements of operations
for the years ended December 31, 2006 and 2005, and with respect to the consolidated balance sheets at
December 31, 2007, 2006 and 2005 are derived from our audited consolidated financial statements, which are
not included in this Annual Report. This selected financial data should be read in conjunction with the Consolidated
Financial Statements and related notes thereto included in this Annual Report and “Management’s Discussion and
Analysis of Financial Condition and Results of Operations.”
2009 2008(1) 2007 2006 2005
For the Years Ended December 31,
(In thousands, except per share data)
Statements of Operations Data:
Total revenue . . . . . . . . . . . . . . . . . . . . . . . . . . $2,472,638 $ 1,663,992 $ 922,066 $ 637,235 $ 242,245
Net loss . . . . . . . . . . . . . . . . . . . . . . . . . . . . . (342,790) (5,313,288) (565,252) (1,104,867) (862,997)
Net loss per share (basic and diluted) . . . . . . . . . $ (0.15) $ (2.45) $ (0.39) $ (0.79) $ (0.65)
Weighted average common shares outstanding
(basic and diluted) . . . . . . . . . . . . . . . . . . . . 3,585,864 2,169,489 1,462,967 1,402,619 1,325,739
Balance Sheet Data:
Cash and cash equivalents . . . . . . . . . . . . . . . . . $ 383,489 $ 380,446 $ 438,820 $ 393,421 $ 762,007
Restricted investments . . . . . . . . . . . . . . . . . . . 3,400 141,250 53,000 77,850 107,615
Total assets . . . . . . . . . . . . . . . . . . . . . . . . . . . 7,263,528 7,459,736 1,687,231 1,650,147 2,075,519
Long-term debt, net of current portion . . . . . . . . 3,062,693 2,820,781 1,271,699 1,059,868 1,074,594
Stockholders’ equity (deficit)(2) . . . . . . . . . . . . . 37,432 8,537 (792,737) (389,071) 324,968
(1) The 2008 results and balances reflect the results and balances of XM Holdings from the date of the Merger and a
$4,766,190 goodwill impairment charge.
(2) No cash dividends were declared or paid in any of the periods presented.
49