Volvo 2001 Annual Report Download - page 92
Download and view the complete annual report
Please find page 92 of the 2001 Volvo annual report below. You can navigate through the pages in the report by either clicking on the pages listed below, or by using the keyword search tool below to find specific information within the annual report.-
 1
1 -
2
-
3
-
4
-
5
-
6
-
7
-
8
-
9
-
10
-
11
-
12
-
13
-
14
-
15
-
16
-
17
-
18
-
19
-
20
-
21
-
22
-
23
-
24
-
25
-
26
-
27
-
28
-
29
-
30
-
31
-
32
-
33
-
34
-
35
-
36
-
37
-
38
-
39
-
40
-
41
-
42
-
43
-
44
-
45
-
46
-
47
-
48
-
49
-
50
-
51
-
52
-
53
-
54
-
55
-
56
-
57
-
58
-
59
-
60
-
61
-
62
-
63
-
64
-
65
-
66
-
67
-
68
-
69
-
70
-
71
-
72
-
73
-
74
-
75
-
76
-
77
-
78
-
79
-
80
-
81
-
 82
82 -
 83
83 -
 84
84 -
 85
85 -
 86
86 -
 87
87 -
 88
88 -
 89
89 -
 90
90 -
 91
91 -
 92
92 -
 93
93 -
 94
94 -
 95
95 -
 96
96 -
 97
97 -
 98
98 -
 99
99 -
 100
100 -
 101
101 -
 102
102 -
103
-
104
-
105
-
106
-
107
-
108
-
109
-
110
-
111
-
112
-
113
-
114
-
115
-
116
 |
 |

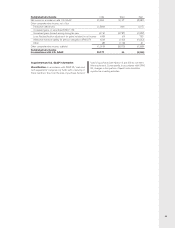
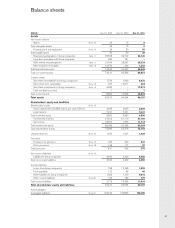
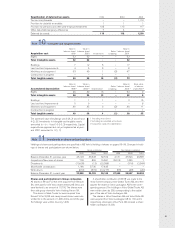
PARENT COMPANY AB VOLVO
88
SEK M 1999 2000 2001
Operating activities
Operating income (588) (300) (424)
Depreciation and amortization 19 17 17
Other items not affecting cash – (49) –
Changes in working capital:
Increase (–)/decrease (+) in receivables 893 207 (219)
Increase (+)/decrease (–) in liabilities and provisions (886) (620) 65
Dividends received and Group contributions 24,270 2,735 27,188
Interest and similar items received 491 148 662
Interest and similar items paid (684) (330) (410)
Other financial items 72 7 (206)
Income taxes paid (460) (147) (530)
Cash flow from operating activities 23,127 1,668 26,143
Investing activities
Investments in fixed assets (2) (10) (9)
Disposals of fixed assets 12 0 0
Shares and participations in Group companies, net 15,441 (6,264) 15,849
Shares and participations in non-Group companies, net (25,517) (1,209) 3,181
Cash flow after net investments 13,061 (5,815) 45,164
Financing activities
Increase (+)/ decrease (–) in loans (8,566) 14,434 (15,659)
Long-term receivables, net – – 60
Dividend to AB Volvo shareholders (2,649) (3,091) (3,356)
Repurchase of own shares – (11,808) (8,336)
Change in liquid funds 1,846 (6,280) 17,873
Liquid funds at January 1 4,441 6,287 7
Liquid funds at December 31 6,287 7 17,880
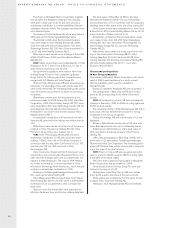
Notes to cash flow statements
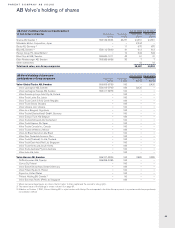
Shares and participations in Group companies, net
Investments (1,431) (6,675) (7,671)
Disposals 16,872 411 23,520
Net investments in shares and participations in Group companies 15,441 (6,264) 15,849
Investments during 2001 pertained mainly to payment of shareholders contributions, 5,846 and subscription for new shares in
Mack Trucks Inc, 1,490. Renault V.I. was transferred Group-internal for 10,700.
Proceeds received from the sale of Volvo Personvagnar Holding AB resulted in a positive cash flow of 12,539 (382; 16,136).
Other investments and sales of shares in Group companies are shown in Note 11, pages 91–92.
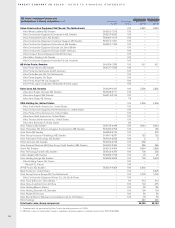
Shares and participations in non-Group companies, net
Investments (25,518) (1,328) (1)
Disposals 1 119 3,182
Net investments in shares and participations in non-Group companies (25,517) (1,209) 3,181
Investments pertained mainly to shares in Scania AB, – (1,328; 23,023), and
Mitsubishi Motors Corporation, – (–; 2,343). During 2001 Mitsubishi Motors Corporation was sold for 3,182.
Other investments and sales of shares in non-Group companies are presented in Note 11, pages 91–92.
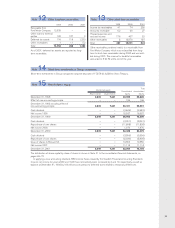
Increase/decrease in loans
New loans 2,363 14,434 104
Amortization (10,929) – (15,763)
Change in loans, net (8,566) 14,434 (15,659)
Long-term receivables, net
New loans granted – – (40)
Amortization received – – 100
Change in long-term receivables, net ––60
Liquid funds
Liquid funds include cash and bank balances and deposits at Volvo Treasury.
Cash flow statements