Volvo 2001 Annual Report Download - page 104
Download and view the complete annual report
Please find page 104 of the 2001 Volvo annual report below. You can navigate through the pages in the report by either clicking on the pages listed below, or by using the keyword search tool below to find specific information within the annual report.-
 1
1 -
2
-
3
-
4
-
5
-
6
-
7
-
8
-
9
-
10
-
11
-
12
-
13
-
14
-
15
-
16
-
17
-
18
-
19
-
20
-
21
-
22
-
23
-
24
-
25
-
26
-
27
-
28
-
29
-
30
-
31
-
32
-
33
-
34
-
35
-
36
-
37
-
38
-
39
-
40
-
41
-
42
-
43
-
44
-
45
-
46
-
47
-
48
-
49
-
50
-
51
-
52
-
53
-
54
-
55
-
56
-
57
-
58
-
59
-
60
-
61
-
62
-
63
-
64
-
65
-
66
-
67
-
68
-
69
-
70
-
71
-
72
-
73
-
74
-
75
-
76
-
77
-
78
-
79
-
80
-
81
-
82
-
83
-
84
-
85
-
86
-
87
-
88
-
89
-
90
-
91
-
92
-
93
-
 94
94 -
 95
95 -
 96
96 -
 97
97 -
 98
98 -
 99
99 -
 100
100 -
 101
101 -
 102
102 -
 103
103 -
 104
104 -
 105
105 -
 106
106 -
 107
107 -
 108
108 -
 109
109 -
 110
110 -
 111
111 -
 112
112 -
 113
113 -
 114
114 -
115
-
116
 |
 |

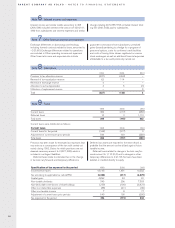
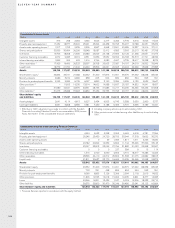
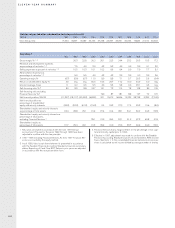
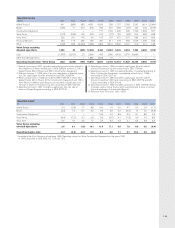
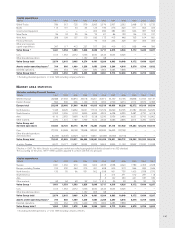
ELEVEN-YEAR SUMMARY
100
Consolidated balance sheets
SEKM 1991 1992 1993 1994 1995 1996 1997 1998 1999 2000 2001
Intangible assets 373 298 2.284 4,545 5,626 2,277 3,284 5,778 6,618 6,925 17,525
Property, plant and equipment 17,232 18,377 25,922 25,991 25,094 26,458 30,793 36,207 19,788 22,231 33,234
Assets under operating leases 21,317 1,753 2,235 2,205 2,847 4,968 13,501 22,285 12,337 14,216 27,101
Shares and participations 30,399 30,494 26,299 18,548 18,087 12,412 4,583 3,393 29,213 30,481 27,798
Inventories 16,705 18,368 21,390 23,380 23,929 23,148 27,993 32,128 21,438 23,551 31,075
Customer financing receivables 2,672 9,083 8,019 9,351 10,336 15,552 32,304 46,798 34,313 41,791 48,784
Interest bearing receivables 1,842 405 602 1,516 2,766 4,080 4,667 4,735 18,617 19,228 8,079
Other receivables 117,429 16,469 26,323 28,597 26,708 25,603 27,087 34,197 24,019 26,352 39,946
Liquid funds 18,779 21,760 21,442 24,449 23,306 26,661 20,603 20,224 29,269 15,968 27,383
Assets 106,748 117,007 134,516 138,582 138,699 141,159 164,815 205,745 195,612 200,743 260,925
Shareholders’ equity 133,864 29,721 27,088 43,332 51,200 57,876 61,951 69,375 97,692 88,338 85,185
Minority interests 4,986 3,919 6,686 838 605 504 899 860 544 593 391
Provision for postemployment benefits 4,245 5,085 6,139 6,097 6,890 3,150 3,296 2,936 2,130 2,632 14,647
Other provisions 3–11,653 14,235 13,914 14,602 14,988 19,657 25,187 14,832 14,941 18,427
Loans 31,980 42,641 42,675 33,551 28,166 31,886 41,217 64,230 53,345 66,233 81,568
Other liabilities 331,673 23,988 37,693 40,850 37,236 32,755 37,795 43,157 27,069 28,006 60,707
Shareholders’ equity
and liabilities 106,748 117,007 134,516 138,582 138,699 141,159 164,815 205,745 195,612 200,743 260,925
Assets pledged 2,641 4,114 4,613 6,527 5,434 6,503 6,743 5,388 3,930 2,990 3,737
Contingent liabilities 4,691 6,808 8,656 7,581 7,450 6,188 5,406 6,737 6,666 6,789 10,441
1Effective in 1997, adjustment was made to conform with the Swedish
Financial Accounting Standard Council's recommendation, RR9, Income
Taxes. See Note 1 to the consolidated financial statements.
2Including company vehicles up to and including 1991.
3Other provisions are included among other liabilities up to and including
1991.
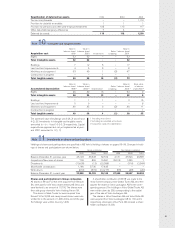
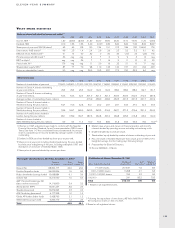
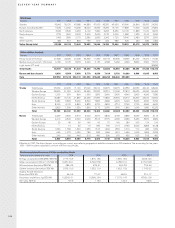
Consolidated balance sheet excluding Financial Services1
SEKM 1991 1992 1993 1994 1995 1996 1997 1998 1999 2000 2001
Intangible assets 4,544 5,623 2,258 3,262 5,692 6,518 6,781 17,366
Property, plant and equipment 25,246 23,430 24,720 28,755 33,944 17,318 19,652 30,370
Assets under operating leases 0 0 49 1,366 1,817 1,611 4,245 15,020
Shares and participations 20,782 20,699 16,359 9,894 11,744 35,296 37,366 35,145
Inventories 23,047 23,813 23,042 27,756 31,883 21,053 22,998 30,557
Customer financing receivables 0 0 0 227 384 9 15 114
Interest bearing receivables 1,516 2,720 4,060 4,664 4,715 18,617 19,286 12,426
Other receivables 28,596 26,110 24,312 25,802 31,398 21,075 24,882 38,815
Liquid funds 21,811 20,637 23,170 16,605 15,439 24,465 10,958 24,874
Assets 125,542 123,032 117,970 118,331 137,016 145,962 146,183 204,687
Shareholders’ equity 43,332 51,200 57,876 61,951 69,375 97,692 88,338 85,185
Minority interests 703 351 448 859 804 544 593 391
Provision for post-employment benefits 6,060 6,855 3,126 3,266 2,904 2,118 2,619 14,632
Other provisions 11,806 12,525 12,618 15,962 19,435 9,861 8,277 14,085
Loans 24,266 16,301 13,432 1,047 5,018 12,206 18,233 29,710
Other liabilities 39,375 35,800 30,470 35,246 39,480 23,541 28,123 60,684
Shareholders’ equity and liabilities 125,542 123,032 117,970 118,331 137,016 145,962 146,183 204,687
1Financial Services reported in accordance with the equity method.