Volvo 2001 Annual Report Download - page 21
Download and view the complete annual report
Please find page 21 of the 2001 Volvo annual report below. You can navigate through the pages in the report by either clicking on the pages listed below, or by using the keyword search tool below to find specific information within the annual report.-
 1
1 -
2
-
3
-
4
-
5
-
6
-
7
-
8
-
9
-
10
-
 11
11 -
 12
12 -
 13
13 -
 14
14 -
 15
15 -
 16
16 -
 17
17 -
 18
18 -
 19
19 -
 20
20 -
 21
21 -
 22
22 -
 23
23 -
 24
24 -
 25
25 -
 26
26 -
 27
27 -
 28
28 -
 29
29 -
 30
30 -
 31
31 -
32
-
33
-
34
-
35
-
36
-
37
-
38
-
39
-
40
-
41
-
42
-
43
-
44
-
45
-
46
-
47
-
48
-
49
-
50
-
51
-
52
-
53
-
54
-
55
-
56
-
57
-
58
-
59
-
60
-
61
-
62
-
63
-
64
-
65
-
66
-
67
-
68
-
69
-
70
-
71
-
72
-
73
-
74
-
75
-
76
-
77
-
78
-
79
-
80
-
81
-
82
-
83
-
84
-
85
-
86
-
87
-
88
-
89
-
90
-
91
-
92
-
93
-
94
-
95
-
96
-
97
-
98
-
99
-
100
-
101
-
102
-
103
-
104
-
105
-
106
-
107
-
108
-
109
-
110
-
111
-
112
-
113
-
114
-
115
-
116
 |
 |

17
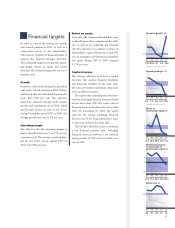
2001 was also positively affected by capital-
ization of development costs amounting to
SEK 1,586 M and gain on divestment of
shares in Mitsubishi Motors Corporation
amounting to SEK 574 M.
Lower volumes and low capacity utiliza-
tion, particularly in the North American
plants, were mainly responsible for the oper-
ating loss in Buses of SEK 524 M excluding
restructuring costs, (2000: income of SEK
440 M). Construction Equipment reported
operating income, excluding restructuring
costs, of SEK 891 M compared with SEK
1,594 in the year earlier. The lower earnings
was primarily explained by significantly
lower demand in North America and changes
in the product mix.
Operating income in 2001 for Volvo
Penta was the best ever and amounted to
SEK 658 M (484). In Volvo Aero, operating
income amounted to SEK 653 M which was
higher than the preceding year (SEK 621 M)
despite the downturn in air traffic during the
end of the year.
Operating income within Financial
Services amounted to SEK 325 M (1,499).
The income in 2001 was charged with sig-
nificant losses in the US truck financing
portfolio, of which SEK 670 M in the second
quarter. Toward the end of the year, the losses
and repossessions in the US portfolio were
decreasing, although still at a high level. The
operating income of Financial Services in
2001 included a gain on the divestment of
Volvia’s insurance operations amounting to
SEK 562 M, while income in 2000 included
gains of SEK 610 M relating to Volvia's secu-
rities portfolio.
Group operating income in 2001 was nega-
tively affected by provisions of SEK 292 M
relating to a deficit within the Volvo Group’s
Swedish pension foundation for securing
commitments in accordance with the ITP
plan. The deficit was a result of the down-
turn on the stock markets. Operating income
in 2000 included a positive impact of SEK
683 M relating to surplus funds from the
Alecta (previously SPP) insurance company.
Operating income in 2000 also included an
adjustment of the gain on divestment of
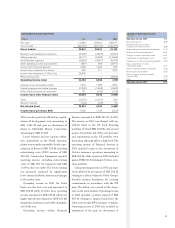
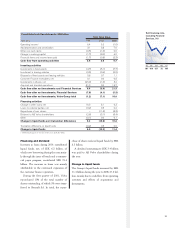
Consolidated income statements
SEK M 1999 2000 2001
Net sales 116,382 120,392 180,615
Cost of sales (92,772) (97,131) (149,477)
Gross income 23,610 23,261 31,138
Research and development expenses (4,525) (4,876) (5,391)
Selling expenses (8,117) (9,285) (14,663)
Administrative expenses (4,632) (4,651) (6,474)
Other operating income and expenses (587) 309 (3,071)
Income from Financial Services 1,066 1,499 325
Income from investments in shares 648 411 1,322
Income from divestment of Volvo Cars 26,695 – –
Restructuring costs – – (3,862)
Operating income (loss) 34,158 6,668 (676)
Interest income and similar credits 1,812 1,588 1,653
Interest expenses and similar charges (1,505) (1,845) (2,653)
Other financial income and expenses 131 (165) (190)
Income (loss) after financial items 34,596 6,246 (1,866)
Taxes (2,270) (1,510) 326
Minority interests (104) (27) 73
Net income (loss) 32,222 4,709 (1,467)
Income (loss) per share, SEK 73.00 11.20 (3.50)
Change of operating income
SEK billion
Operating income 2000 6.7
Restructuring costs (3.9)
Decreased volumes, changes
in product and market mix etc. (2.8)
Higher selling and administrative expenses (1.1)
Acquired and divested operations +0.6
Changes in currency exchange rates +0.5
Capitalization of development costs +2.0
Credit losses in US truck financing portfolio (0.7)
Gain on divestment of shares
in Mitsubishi Motors +0.6
Deficit in Swedish pension foundation (0.3)
Alecta surplus funds 2000 (0.7)
Gains on sale of securities portfolio
in Volvia 2000 (0.6)
Other (1.0)
Operating income 2001 (0.7)