Volvo 2001 Annual Report Download - page 70
Download and view the complete annual report
Please find page 70 of the 2001 Volvo annual report below. You can navigate through the pages in the report by either clicking on the pages listed below, or by using the keyword search tool below to find specific information within the annual report.-
 1
1 -
2
-
3
-
4
-
5
-
6
-
7
-
8
-
9
-
10
-
11
-
12
-
13
-
14
-
15
-
16
-
17
-
18
-
19
-
20
-
21
-
22
-
23
-
24
-
25
-
26
-
27
-
28
-
29
-
30
-
31
-
32
-
33
-
34
-
35
-
36
-
37
-
38
-
39
-
40
-
41
-
42
-
43
-
44
-
45
-
46
-
47
-
48
-
49
-
50
-
51
-
52
-
53
-
54
-
55
-
56
-
57
-
58
-
59
-
 60
60 -
 61
61 -
 62
62 -
 63
63 -
 64
64 -
 65
65 -
 66
66 -
 67
67 -
 68
68 -
 69
69 -
 70
70 -
 71
71 -
 72
72 -
 73
73 -
 74
74 -
 75
75 -
 76
76 -
 77
77 -
 78
78 -
 79
79 -
 80
80 -
81
-
82
-
83
-
84
-
85
-
86
-
87
-
88
-
89
-
90
-
91
-
92
-
93
-
94
-
95
-
96
-
97
-
98
-
99
-
100
-
101
-
102
-
103
-
104
-
105
-
106
-
107
-
108
-
109
-
110
-
111
-
112
-
113
-
114
-
115
-
116
 |
 |

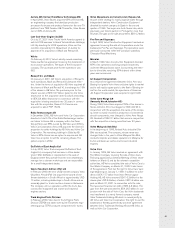
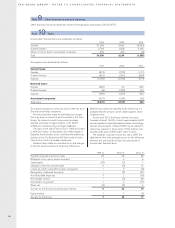
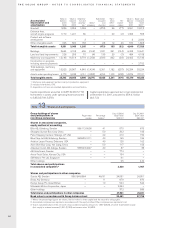
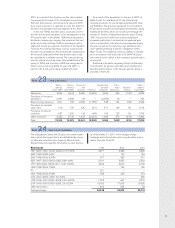
THE VOLVO GROUP · NOTES TO CONSOLIDATED FINANCIAL STATEMENTS
66
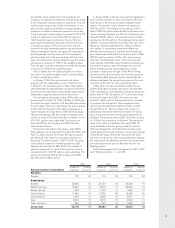
Value in Value in Deprecia- Subsidaries Trans- Value in Book value
Accumulated balance balance tion and acquired lation Re- balance in balance
depreciation and sheet sheet amortiza- Sales/ and differ- classifi- sheet sheet
amortization 1999 2000 tion 2scrapping divested ences cations 2001 2001 3
Goodwill 1,836 2,354 1,058 – (470) 96 (77) 2,961 13,013
Entrance fees,
aircraft engine programs 1,170 1,221 66 – – 20 (1) 1,306 783
Product and software
development – – 3 – – – – 3 2,036
Other intangible assets 325 390 138 – (3) 19 26 570 1,693
Total intangible assets 3,331 3,965 1,265 – (473) 135 (52) 4,840 17,525
Buildings 3,654 4,198 696 (164) 1,531 291 (144) 6,408 10,641
Land and land improvements 226 255 70 (4) 135 29 (1) 484 4,108
Machinery and equipment 115,143 16,514 3,779 (1,256) 3,595 862 (92) 23,402 15,733
Construction in progress,
including advance payments – – – – – – – – 2,752
Total buildings, machinery
and equipment 19,023 20,967 4,545 (1,424) 5,261 1,182 (237) 30,294 33,234
Assets under operating leases 4,179 5,038 4,151 (1,853) 6,764 1,109 (233) 14,976 27,101
Total tangible assets 23,202 26,005 8,696 (3,277) 12,025 2,291 (470) 45,270 60,335
1 Machinery and equipment pertains mainly to production equipment.
2 Includes write-downs, 573.
3 Acquisition cost less accumulated depreciation and amortization.
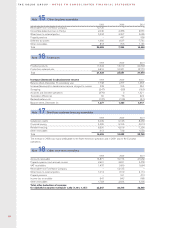
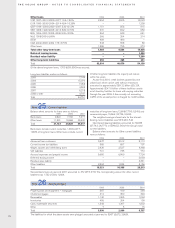
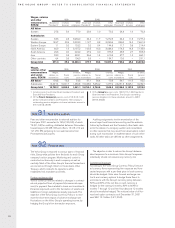
Group holdings of shares Dec 31,2000 Dec 31,2001
and participations in Registration Percentage Book value Book value
non-Group companies number holding 1SEK M 2SEK M 2
Shares in associated companies,
equity method of accounting
Bilia AB, Göteborg, Sweden 556112-5690 41 570 679
Shanghai Sunwin Bus Corp, China — 50 202 193
Petro Stopping Centers Holdings, LP, USA — 29 210 159
Blue Chip Jet HB, Göteborg, Sweden 969639-1011 40 165 156
Aviation Lease Finance, Delaware, USA — 49 125 162
Xian Silver Bus Corp., Yan Liang, China — 50 117 143
Arbustum Invest AB, Arboga, Sweden 556543-4247 40 37 33
AB Volvofinans, Sweden — — 774 –
Arrow Truck Sales, Kansas City, USA — — 134 –
SM Motors Pte Ltd, Singapore — — 91 –
Other holdings 95 442
Total shares and participations
in associated companies 32,520 1,967
Shares and participations in other companies
Scania AB, Sweden 556184-8564 46/31 24,051 24,051
Deutz AG, Germany – 11 670 670
Henlys Group Plc, Great Britain – 10 524 524
Mitsubishi Motors Corporation, Japan — — 2,344 –
Other holdings 372 586
Total shares and participations in other companies 27,961 25,831
Book value in accordance with Group balance sheet 30,481 27,798
1 Where two percentage figures are shown, the first refers to share capital and the second to voting rights.
2 Associated companies are reported in accordance with the equity method. Other companies are reported at cost.
3 Volvo’s calculated share of the net worth of associated companies amounts to 1,967 (2,520), of which shareholders’ equity
(incl. equity in untaxed reserves) 1,951 (2,100) and excess value 16 (420).
Capital expenditures amounted to 8,287 (5,430; 5,172).
Investments in assets under operating leases amounted
to 5,852 (5,709; 5,578).
Capital expenditures approved but not yet implemented
at December 31, 2001, amounted to SEK 6.1 billion
(6.8; 7.2).
Note 13 Shares and participations