Volvo 2001 Annual Report Download - page 44
Download and view the complete annual report
Please find page 44 of the 2001 Volvo annual report below. You can navigate through the pages in the report by either clicking on the pages listed below, or by using the keyword search tool below to find specific information within the annual report.-
 1
1 -
2
-
3
-
4
-
5
-
6
-
7
-
8
-
9
-
10
-
11
-
12
-
13
-
14
-
15
-
16
-
17
-
18
-
19
-
20
-
21
-
22
-
23
-
24
-
25
-
26
-
27
-
28
-
29
-
30
-
31
-
32
-
33
-
 34
34 -
 35
35 -
 36
36 -
 37
37 -
 38
38 -
 39
39 -
 40
40 -
 41
41 -
 42
42 -
 43
43 -
 44
44 -
 45
45 -
 46
46 -
 47
47 -
 48
48 -
 49
49 -
 50
50 -
 51
51 -
 52
52 -
 53
53 -
 54
54 -
55
-
56
-
57
-
58
-
59
-
60
-
61
-
62
-
63
-
64
-
65
-
66
-
67
-
68
-
69
-
70
-
71
-
72
-
73
-
74
-
75
-
76
-
77
-
78
-
79
-
80
-
81
-
82
-
83
-
84
-
85
-
86
-
87
-
88
-
89
-
90
-
91
-
92
-
93
-
94
-
95
-
96
-
97
-
98
-
99
-
100
-
101
-
102
-
103
-
104
-
105
-
106
-
107
-
108
-
109
-
110
-
111
-
112
-
113
-
114
-
115
-
116
 |
 |

40
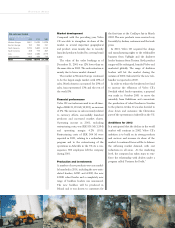
Market development
Compared with the preceding year, Volvo
CE was able to strengthen its share of the
market in several important geographical
and product areas mainly due to recently
launched products backed by a strong brand
name.
The value of the order bookings as of
December 31, 2001 was 12% lower than on
the same date in 2000. The order situation is
mainly due to lower market demand.
The market in Western Europe continued
to be the largest single market with 49% of
sales, North America accounted for 29% of
sales, Asia represented 13% and the rest of
the world 9%.
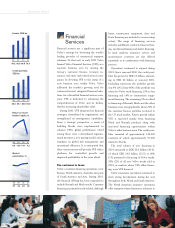
Financial performance
Volvo CE’s net sales increased to an all-time-
high of SEK 21,135 M (19,993), an increase
of 6%. The increase in sales is mainly related
to currency effects, successfully launched
products and increased market shares.
Operating income in 2001, excluding
restructuring costs, was SEK 891 M (1,594)
and operating margin 4.2% (8.0).
Restructuring costs of SEK 364 M were
reported in 2001, relating to a redundancy
program and to the restructuring of the
operations in Asheville in the US. As a con-
sequence, 900 employees left the company
during 2001.
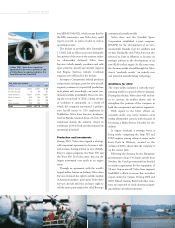
Production and investments
A number of new products were successful-
ly launched in 2001, including the new artic-
ulated haulers, A25D and A30D, the new
L220E wheel loader and a completely new
range of backhoe loaders was announced.
The new backhoe will be produced in
Poland and it was shown to customers for
BUSINESS AREAS
the first time at the ConExpo fair in March
2002. The new products were received very
favorably by dealers, customers and the trade
press.
In 2001, Volvo CE acquired the design
and manufacturing rights to the telehandler
business from UpRight and the skidsteer
loader business from Textron. Both product
ranges will be redesigned, branded Volvo and
marketed globally. The range of skidsteer
loaders will hit the market during the
autumn of 2002. Sales start for the new tele-
handler is expected in 2003.
In order to reduce the breakeven level and
to increase the efficiency of Volvo CE’s
Swedish wheel loader operation, a proposal
was made in October 2001 to move the
assembly from Eskilstuna and concentrate
the production of wheel loaders in Sweden
to the plant in Arvika. It was also decided to
close down and outsource the fabrication
part of the operations in Asheville in the US.
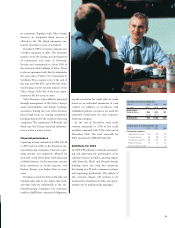
Ambitions for 2002
It is anticipated that the decline in the world
market will continue in 2002. Volvo CE's
ambition is to build on its strong products
and services and increase its share of the
market. A continued focus will be to balance
the softening market demand, with cost
reductions in all areas. At the marketing
level, the company has taken steps to rein-
force the relationship with dealers under a
program called “Partners for Profit.”
Net sales per market
Construction Equipment
SEK M 1999 2000 2001
Western Europe 9,901 10,029 10,326
Eastern Europe 193 255 341
North America 5,725 5,823 6,145
South America 498 776 847
Asia 1,903 2,484 2,773
Other markets 662 626 703
Total 18,882 19,993 21,135