Volvo 2001 Annual Report Download - page 66
Download and view the complete annual report
Please find page 66 of the 2001 Volvo annual report below. You can navigate through the pages in the report by either clicking on the pages listed below, or by using the keyword search tool below to find specific information within the annual report.-
 1
1 -
2
-
3
-
4
-
5
-
6
-
7
-
8
-
9
-
10
-
11
-
12
-
13
-
14
-
15
-
16
-
17
-
18
-
19
-
20
-
21
-
22
-
23
-
24
-
25
-
26
-
27
-
28
-
29
-
30
-
31
-
32
-
33
-
34
-
35
-
36
-
37
-
38
-
39
-
40
-
41
-
42
-
43
-
44
-
45
-
46
-
47
-
48
-
49
-
50
-
51
-
52
-
53
-
54
-
55
-
 56
56 -
 57
57 -
 58
58 -
 59
59 -
 60
60 -
 61
61 -
 62
62 -
 63
63 -
 64
64 -
 65
65 -
 66
66 -
 67
67 -
 68
68 -
 69
69 -
 70
70 -
 71
71 -
 72
72 -
 73
73 -
 74
74 -
 75
75 -
 76
76 -
77
-
78
-
79
-
80
-
81
-
82
-
83
-
84
-
85
-
86
-
87
-
88
-
89
-
90
-
91
-
92
-
93
-
94
-
95
-
96
-
97
-
98
-
99
-
100
-
101
-
102
-
103
-
104
-
105
-
106
-
107
-
108
-
109
-
110
-
111
-
112
-
113
-
114
-
115
-
116
 |
 |

THE VOLVO GROUP · NOTES TO CONSOLIDATED FINANCIAL STATEMENTS
62
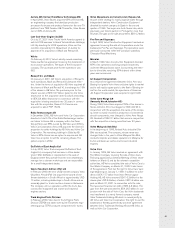
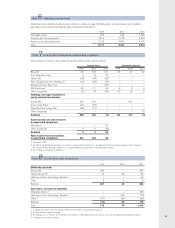
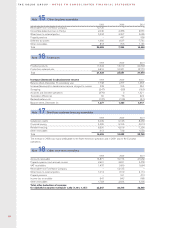
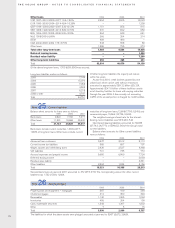
Net sales per business and market area are shown in tables on page 16.
Other operating income and expenses include losses on forward and options contracts of 2,044 (700; 620), amortiza-
tion of goodwill amounting to 1,058 (491; 398), surplus funds from Alecta (previously SPP) 43 (683; –), gain on sale
of Volvia’s operations 562 (–; –) and adjustment of the gain on sale of Volvo Cars 90 (520; –).
Restructuring costs in 2001 amounted to 3,862 of which
3,106 for Global Trucks, 392 for Buses and 364 for
Construction Equipment.
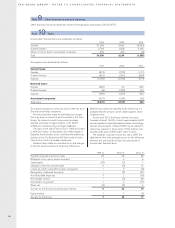
Restructuring costs in Global Trucks included costs for
the integration of Mack Trucks and Renault Trucks in order
to secure coordination gains made possible through the
acquisition. The integration measures included reduction
of the North American production capacity through a
decision to close Mack’s Winnsboro plant and transfer of
production to Volvo’s New River Valley plant. Integration
measures further included restructuring of the global
distribution system and production structure. In addition
to the integration measures, restructuring costs in Global
Trucks included significant personnel reductions due to
the prevailing business conditions, especially in North
America. Restructuring costs in Buses were attributable to
the shut down of Nova Bus’ plant for city buses in Roswell,
United States. In Construction Equipment, restructuring
measures were pertaining to close down of fabrication
in the Asheville plant, United States, and to an overall
redundancy program.
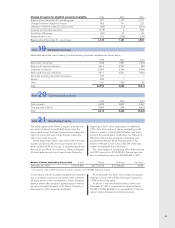
Of the total restructuring costs, 2,259 was attributable
to contractual pensions and excess personnel, 573 was
attributable to writedowns of assets and the remainder,
1,030 to other restructuring costs.
Note 3Net sales
Note 4Other operating income and expenses
Note 5Restructuring costs
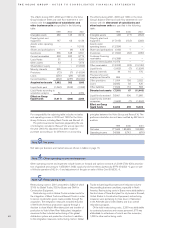
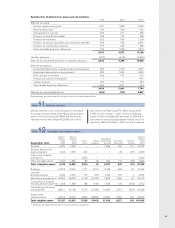
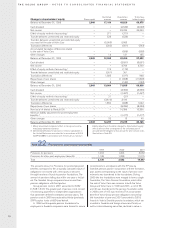
The effects during 2001, 2000 and 1999 on the Volvo
Group’s balance sheet and cash flow statement in con-
nection with the divestment of subsidiaries and
other business units are specified in the following
table:
1999 2000 2001
Intangible assets (46) (17) (354)
Property, plant and
equipment (17,915) (132) (288)
Assets under
operating leases (12,324) – –
Shares and participations (100) 7 –
Inventories (11,600) (69) (939)
Customer-financing
receivables (19,288) – –
Loans to external parties 10,474 – –
Other receivables (13,203) (93) (12,139)
Liquid funds (1,602) (7) (1,824)
Minority interests 49 10 176
Provisions for post-
employment benefits 866 – –
Other provisions 11,054 158 2,922
Loans 28,682 38 420
Other liabilities 17,622 172 583
Divested net assets (7,331) 67 (11,443)
Liquid funds received 33,661 506 11,860
Liquid funds, divested
companies (1,602) (7) (1,824)
Effect on Group
liquid funds 32,059 499 10,036
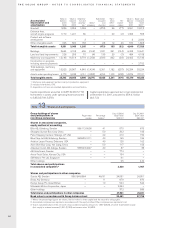
The effects during 2001, 2000 and 1999 on the Volvo
Group’s balance sheet and cash flow statement in con-
nection with the acquisition of subsidiaries and
other business units are specified in the following
table:
1999 2000 2001
Intangible assets 480 125 8,914
Property, plant and
equipment 147 68 9,126
Assets under operating
lease – – 10,195
Shares and participations – (9) 433
Inventories 365 348 9,361
Current receivables 233 300 8,774
Liquid funds 51 2 4,059
Other assets 43 1 7,674
Shareholders’ equity – – (10,356)
Minority interests 335 – –
Provisions (72) (7) (14,524)
Loans (256) (89) (2,543)
Current liabilities (264) (237) (30,020)
Acquired net assets 1,062 502 1,093
Liquid funds paid (1,062) (502) (1,093)
Liquid funds according to
acquisition analysis 51 2 4,059
Effect on Group
liquid funds (1,011) (500) 2,966
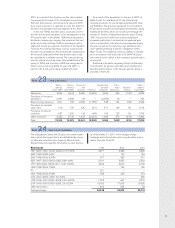
For comparability the adjoining table includes net sales
and operating income in 2000 and 1999 for the Volvo
Group Proforma, including Mack Trucks and Renault V.I.
The proforma amounts have been prepared by the use
of information included in Renault V.I.’s annual report for
the year 2000. No adjustment has been made for
purchase accounting or for differences in accounting
1999 2000 2001
Net sales 177,682 185,988 189,280
Operating income 34,586 8,742 (676)
principles between the Volvo Group and Renault V.I. The
proforma calculation has not been audited by AB Volvo’s
auditors.