Volvo 2001 Annual Report Download - page 108
Download and view the complete annual report
Please find page 108 of the 2001 Volvo annual report below. You can navigate through the pages in the report by either clicking on the pages listed below, or by using the keyword search tool below to find specific information within the annual report.-
 1
1 -
2
-
3
-
4
-
5
-
6
-
7
-
8
-
9
-
10
-
11
-
12
-
13
-
14
-
15
-
16
-
17
-
18
-
19
-
20
-
21
-
22
-
23
-
24
-
25
-
26
-
27
-
28
-
29
-
30
-
31
-
32
-
33
-
34
-
35
-
36
-
37
-
38
-
39
-
40
-
41
-
42
-
43
-
44
-
45
-
46
-
47
-
48
-
49
-
50
-
51
-
52
-
53
-
54
-
55
-
56
-
57
-
58
-
59
-
60
-
61
-
62
-
63
-
64
-
65
-
66
-
67
-
68
-
69
-
70
-
71
-
72
-
73
-
74
-
75
-
76
-
77
-
78
-
79
-
80
-
81
-
82
-
83
-
84
-
85
-
86
-
87
-
88
-
89
-
90
-
91
-
92
-
93
-
94
-
95
-
96
-
97
-
 98
98 -
 99
99 -
 100
100 -
 101
101 -
 102
102 -
 103
103 -
 104
104 -
 105
105 -
 106
106 -
 107
107 -
 108
108 -
 109
109 -
 110
110 -
 111
111 -
 112
112 -
 113
113 -
 114
114 -
 115
115 -
 116
116
 |
 |

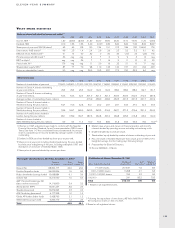
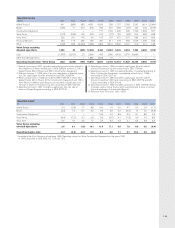
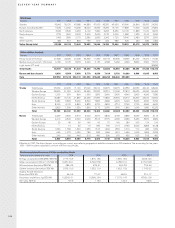
ELEVEN-YEAR SUMMARY
104
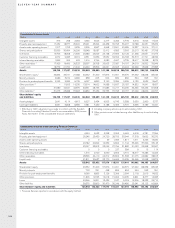
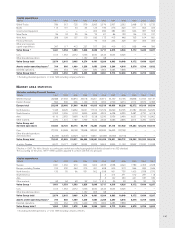
Net sales
SEKM 1991 1992 1993 1994 1995 1996 1997 1998 1999 2000 2001
Global Trucks Western Europe 16,718 15,252 15,851 22.718 24,289 23,268 25,180 30,666 32,750 33,383 64,262
Eastern Europe 528 518 599 948 1,299 1,721 2,274 3,089 2,265 3,158 5,532
North America 5,714 6,933 11,817 13,951 13,069 8,510 12,206 17,659 22,303 17,201 33,747
South America 1,606 484 3,188 4,780 4,641 2,759 3,832 3,777 2,190 3,111 3,994
Asia 3,066 1,675 2,170 2,474 2,863 2,577 2,410 2,047 2,010 3,432 4,683
Other markets 435 1,130 330 1,379 1,330 1,443 1,503 1,267 1,492 1,911 7,922
Total 28,067 25,992 33,955 46,250 47,491 40,278 47,405 58,505 63,010 62,196 120,140
Buses Western Europe 2,600 2,581 3,380 3,838 4,709 4,660 5,082 5,528 5,735 6,767 6,263
Eastern Europe 12 3 62 102 34 80 190 366 226 182 373
North America 2 1 43 34 736 1,575 2,314 5,574 6,871 7,723 6,847
South America 522 728 897 1,005 1,087 853 1,002 910 469 732 757
Asia 514 572 986 868 844 1,112 1,562 1,519 943 1,269 1,839
Other markets 170 566 119 289 285 247 432 389 469 514 596
Total 3,820 4,451 5,487 6,136 7,695 8,527 10,582 14,286 14,713 17,187 16,675
Construction Western Europe 4,199 7,163 7,836 9,557 9,901 10,029 10,326
Equipment 1Eastern Europe 112 93 263 336 193 255 341
North America 1,403 3,385 5,680 6,548 5,725 5,823 6,145
South America 556 598 991 957 498 776 847
Asia 339 937 1,036 1,092 1,903 2,484 2,773
Other markets 307 628 847 882 662 626 703
Total 6,916 12,804 16,653 19,372 18,882 19,993 21,135
Volvo Penta Western Europe 1,563 1,478 1,541 1,753 2,065 2,048 2,219 2,725 2,986 3,204 3,789
Eastern Europe 0 0 0 0 1 2 34 23 26 30 38
North America 437 483 859 1,326 1,139 1,142 1,332 1,412 1,770 2,257 2,175
South America 159 92 74 92 99 109 136 153 134 160 213
Asia 406 407 434 464 458 486 643 476 692 794 988
Other markets 20 82 78 107 116 98 102 142 153 154 177
Total 2,585 2,542 2,986 3,742 3,878 3,885 4,466 4,931 5,761 6,599 7,380
Volvo Aero Western Europe 2,473 2,146 2,281 2,400 2,590 2,950 3,682 4,231 4,560 4,651 4,788
Eastern Europe 4 0 0 13 27 8 6 47 16 42 87
North America 1,208 1,244 1,326 1,104 1,100 1,071 3,066 3,502 4,557 5,040 5,841
South America 0 13 4 0 4 4 257 284 193 134 187
Asia 11 6 5 66 66 89 264 336 491 701 708
Other markets 4 9 11 5 3 21 201 184 136 145 173
Total 3,700 3,418 3,627 3,588 3,790 4,143 7,476 8,584 9,953 10,713 11,784
Other and eliminations 6,161 7,302 9,086 9,039 2,580 645 536 1,952 4,063 3,704 3,501
Net sales excl Financial Services 44,333 43,705 55,141 68,755 72,350 70,282 87,118 107,630 116,382 120,392 180,615
Financial Western Europe 1,113 1,144 1,177 1,198 4,758 5,384 4,461 5,465 6,300 6,240 5,314
Services Eastern Europe 0 0 86 185 257 360
North America 6 54 509 1,152 1,620 2,626 3,216
South America 153 72 297 455 452 451
Asia 00 01024
Other markets 206 44 52 224 76 103 130
Total 1,113 1,144 1,177 1,198 4,970 5,635 5,094 7,224 8,637 9,678 9,495
Eliminations – – – – – – – – – – (830)
Volvo Group excluding
divested operations 45,446 44,849 56,318 69,953 77,320 75,917 92,212 114,854 125,019 130,070 189,280
Cars 37,022 44,598 58,158 73,598 83,340 83,589 96,453 103,798 – – –
Other divested operations
and eliminations (5,245) (6,445) (3,321) 12,315 10,851 (3,446) (5,040) (5,716) – – –
Volvo Group total 77,223 83,002 111,155 155,866 171,511 156,060 183,625 212,936 125,019 130,070 189,280
Effective in 1997, the Volvo Group’s accounting per market area reflects
geographical definitions, based on an ISO standard. The figures for
1991–1996 have been adjusted to conform with the new principle.
1Subsidiary in the Volvo Group as of July 1995. Net sales for the Con-
struction Equipment business area in the years 1991 through 1995, cal-
culated using the average exchange rate for the US dollar in each year,
amounted to 8,273, 7,890, 9,665,12,084 and 13,684.
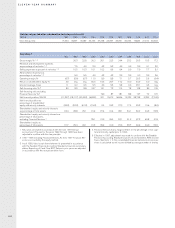
BUSINESS AREA STATI STICS