Volvo 2001 Annual Report Download - page 17
Download and view the complete annual report
Please find page 17 of the 2001 Volvo annual report below. You can navigate through the pages in the report by either clicking on the pages listed below, or by using the keyword search tool below to find specific information within the annual report.-
 1
1 -
2
-
3
-
4
-
5
-
6
-
 7
7 -
 8
8 -
 9
9 -
 10
10 -
 11
11 -
 12
12 -
 13
13 -
 14
14 -
 15
15 -
 16
16 -
 17
17 -
 18
18 -
 19
19 -
 20
20 -
 21
21 -
 22
22 -
 23
23 -
 24
24 -
 25
25 -
 26
26 -
 27
27 -
28
-
29
-
30
-
31
-
32
-
33
-
34
-
35
-
36
-
37
-
38
-
39
-
40
-
41
-
42
-
43
-
44
-
45
-
46
-
47
-
48
-
49
-
50
-
51
-
52
-
53
-
54
-
55
-
56
-
57
-
58
-
59
-
60
-
61
-
62
-
63
-
64
-
65
-
66
-
67
-
68
-
69
-
70
-
71
-
72
-
73
-
74
-
75
-
76
-
77
-
78
-
79
-
80
-
81
-
82
-
83
-
84
-
85
-
86
-
87
-
88
-
89
-
90
-
91
-
92
-
93
-
94
-
95
-
96
-
97
-
98
-
99
-
100
-
101
-
102
-
103
-
104
-
105
-
106
-
107
-
108
-
109
-
110
-
111
-
112
-
113
-
114
-
115
-
116
 |
 |

13
0
97 98 99 00 01
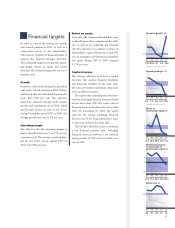
■ Net income,
SEK per share
■ Dividend,
SEK per share
23.2 19.1 73.0 11.2 (3.5)
5.0 6.0 7.0 8.0 8.0
Net income and
dividend per share
97 98 99 00 01
Effective return, %
46 (10) 22 (23) 18
0
97 98 99 00 01
Direct return, %
2.3 3.2 3.2 5.1 4.5
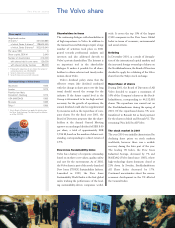
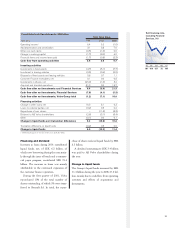
The Volvo share in 2001
Volvo’s market value amounted to SEK 73.0
billion and the Volvo Series B shares
increased by 12.5% in 2001.
Stockholmsbörsen accounts for the largest
percentage of turnover, with an average of
1.7 million Volvo shares traded each day.
During 2001, Volvo was the 14th most
actively traded share in terms of volume,
with a 1.6% share of the total market volume.
Related to the market value, Volvo was num-
ber nine, with a 2.7% share of the total mar-
ket value. Apart from Stockholmsbörsen,
most trading occurs in London and on the
NASDAQ. Trading in Volvo shares in the US
is in the form of ADRs,American Depositary
Receipts, representing Series B shares. The
number of ADR’s traded on the NASDAQ
declined by 8% during the year, and the
number of outstanding ADRs at December
31, 2001, fell by 12% to 8.3 million.
During 2001, the percentage of non-
Swedish shareholders increased from 40% to
47% of the share capital (from 32% to 37%
of the voting rights). Shares held by Swedish
owners were distributed among institutions
(59%), equities funds (16%) and private per-
sons (25%). Of Volvo’s 214,000 sharehold-
ers, the 50 largest accounted for approxi-
mately 70% of the voting rights and 60% of
the share capital, excluding shares held by
Volvo.
Price trend, Volvo Series B shares SEK
Turnover, Volvo Series B shares Millions
Source: Stockholmsbörsen
For more information related to the Volvo share,
see page 103.
Source: Stockholmsbörsen
0
97 98 99 00 01
■ Return on equity, %
■ Shareholders’ equity
per share, SEK
140 157 221 222 203
17.2 13.0 34.9 5.0 (1.7)
ROE and Equity
per share
Number of Volvo Series B shares
traded on the Stockholmsbörsen
90
80
70
60
50
40
30
20
10
0
97 98 99 00 01
Highest and lowest price per month
on the Stockholmsbörsen
97 98 99 00
500
450
400
350
300
250
200
150
100
50
0
01
General Index