Volvo 2001 Annual Report Download - page 105
Download and view the complete annual report
Please find page 105 of the 2001 Volvo annual report below. You can navigate through the pages in the report by either clicking on the pages listed below, or by using the keyword search tool below to find specific information within the annual report.-
 1
1 -
2
-
3
-
4
-
5
-
6
-
7
-
8
-
9
-
10
-
11
-
12
-
13
-
14
-
15
-
16
-
17
-
18
-
19
-
20
-
21
-
22
-
23
-
24
-
25
-
26
-
27
-
28
-
29
-
30
-
31
-
32
-
33
-
34
-
35
-
36
-
37
-
38
-
39
-
40
-
41
-
42
-
43
-
44
-
45
-
46
-
47
-
48
-
49
-
50
-
51
-
52
-
53
-
54
-
55
-
56
-
57
-
58
-
59
-
60
-
61
-
62
-
63
-
64
-
65
-
66
-
67
-
68
-
69
-
70
-
71
-
72
-
73
-
74
-
75
-
76
-
77
-
78
-
79
-
80
-
81
-
82
-
83
-
84
-
85
-
86
-
87
-
88
-
89
-
90
-
91
-
92
-
93
-
94
-
 95
95 -
 96
96 -
 97
97 -
 98
98 -
 99
99 -
 100
100 -
 101
101 -
 102
102 -
 103
103 -
 104
104 -
 105
105 -
 106
106 -
 107
107 -
 108
108 -
 109
109 -
 110
110 -
 111
111 -
 112
112 -
 113
113 -
 114
114 -
 115
115 -
116
 |
 |

101
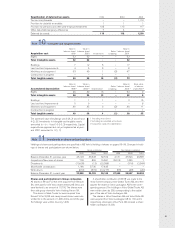
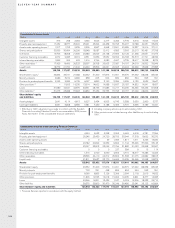
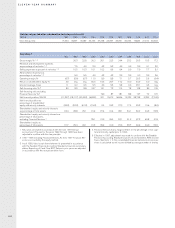
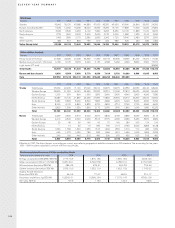
Operating cash flow excluding Financial Services
SEKbn 1991 1992 1993 1994 1995 1996 1997 1998 1999 2000 2001
Operating income 12.9 12.8 12.4 11.1 6.4 5.2 (1.0)
Depreciation 4.8 4.4 5.0 6.4 3.1 3.8 7.0
Other items not affecting cash (4.0) (5.5) (0.5) (1.6) 0.0
Change in working capital (6.3) (11.1) 3.4 0.7 (1.7) (3.0) 6.0
Financial items and income taxes (0.5) (2.3) (1.7) (0.8) (2.3)
Cash flow from operating activities 11.4 6.1 16.3 10.4 5.6 3.6 9.7
Investments in fixed assets (6.4) (8.0) (9.5) (10.2) (4.7) (5.1) (7.7)
Investments in leasing assets (0.8) (0.8) (0.5) (0.9) (0.5) (0.6) (0.5)
Disposals of fixed assets and leasing assets 1.2 1.8 1.0 1.5 0.8 0.7 1.1
Customer-financing receivables, net – – 0.3 (0.3) 0.1 0.0 0.8
Operating cash flow 5.4 (0.9) 7.6 0.5 1.3 (1.4) 3.4
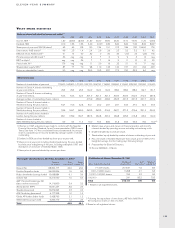
Exports from Sweden
SEKM 1991 1992 1993 1994 1995 1996 1997 1998 1999 2000 2001
Volvo Group, total 31,881 30,344 36,130 43,330 56,059 54,589 58,569 64,401 52,719 46,251 50,394
As from 1992 the effects of major acquisitions and divestments of subsidi-
aries as well as the distribution of the shares in Swedish Match in 1996
have been excluded from other changes in the balance sheet. Furthermore
the effects of changes in exchange rates at translation of foreign subsidi-
aries have been excluded, since these effects do not affect cash flow.
11999, excluding gain on sale of Volvo Cars of SEK 26.7 billion.
2Reported on a single line in 1991–1996.
3Including pensions and similar commitments 1991.
Consolidated cash flow statements
SEKbn 1991 1992 1993 1994 1995 1996 1997 1998 1999 2000 2001
Operating income 1(0.5) (2.9) (0.8) 16.9 13.3 13.2 12.8 11.8 7.5 6.7 (0.7)
Depreciation 3.1 3.1 3.8 5.1 5.6 5.4 6.8 9.6 5.2 6.3 10.0
Other items not affecting cash 2(3.5) (4.9) (0.3) (0.4) 0.5
Change in working capital 2(0.4) 4.6 3.5 (8.9) (7.3) (11.2) 4.7 1.5 (1.0) (3.3) 6.4
Financial items and income tax 2(0.4) (2.0) (1.7) (1.3) (2.1)
Cash flow from
operating activities 2.2 4.8 6.5 13.1 11.6 7.4 20.4 16.0 9.7 8.0 14.1
Investments in fixed assets (2.9) (2.9) (3.5) (4.3) (6.5) (8.2) (9.9) (10.5) (4.9) (5.4) (8.1)
Investments in leasing assets (1.0) (1.3) (1.7) (2.5) (2.6) (3.9) (9.8) (12.7) (5.6) (5.7) (5.8)
Disposals of fixed assets
and leasing assets 1.2 0.3 0.8 1.4 1.3 2.0 1.8 2.6 1.6 2.1 2.6
Customer financing receivables, net (0.1) (3.7) 1.9 (1.5) (1.6) (4.8) (15.5) (12.8) (7.1) (4.5) (3.7)
Shares and participations, net (7.2) (0.2) 0.5 8.2 2.0 14.1 10.7 5.5 (25.9) (1.6) 3.9
Acquired and divested subsidiaries
and other business units, net (0.2) 0.3 0.4 – (4.4) (0.9) (1.3) (5.6) 31.0 0.0 13.0
Cash flow after net investments (8.0) (2.7) 4.9 14.4 (0.2) 5.7 (3.6) (17.5) (1.2) (7.1) 16.0
Increase (decrease) in loans 31.3 3.2 (5.9) (8.3) 1.5 6.8 5.6 19.5 16.3 8.1 6.2
Loans to external parties, net 0.1 0.5 (0.2) (0.9) (0.9) (1.9) (0.4) (0.3) (3.2) 0.3 0.2
Repurchase of own shares –––––––––(11.8) (8.3)
Dividend to AB Volvo shareholders (1.2) (1.2) (0.6) (0.6) (1.5) (1.9) (2.0) (2.2) (2.6) (3.1) (3.4)
Other 7.1 0.4 0.2 (1.3) 0.7 (5.0) (5.9) (0.2) (0.1) 0.0 0.1
Change in liquid funds,
excluding translation differences (0.7) 0.2 (1.6) 3.3 (0.4) 3.7 (6.3) (0.7) 9.2 (13.6) 10.8
Translation differences on liquid funds – 1.8 1.3 (0.3) (0.7) (0.3) 0.3 0.3 (0.2) 0.3 0.6
Change in long-term securities holdings 1.9 0.9 –––––––––
Change in liquid funds 1.2 2.9 (0.3) 3.0 (1.1) 3.4 (6.0) (0.4) 9.0 (13.3) 11.4