Volvo 2001 Annual Report Download - page 71
Download and view the complete annual report
Please find page 71 of the 2001 Volvo annual report below. You can navigate through the pages in the report by either clicking on the pages listed below, or by using the keyword search tool below to find specific information within the annual report.-
 1
1 -
2
-
3
-
4
-
5
-
6
-
7
-
8
-
9
-
10
-
11
-
12
-
13
-
14
-
15
-
16
-
17
-
18
-
19
-
20
-
21
-
22
-
23
-
24
-
25
-
26
-
27
-
28
-
29
-
30
-
31
-
32
-
33
-
34
-
35
-
36
-
37
-
38
-
39
-
40
-
41
-
42
-
43
-
44
-
45
-
46
-
47
-
48
-
49
-
50
-
51
-
52
-
53
-
54
-
55
-
56
-
57
-
58
-
59
-
60
-
 61
61 -
 62
62 -
 63
63 -
 64
64 -
 65
65 -
 66
66 -
 67
67 -
 68
68 -
 69
69 -
 70
70 -
 71
71 -
 72
72 -
 73
73 -
 74
74 -
 75
75 -
 76
76 -
 77
77 -
 78
78 -
 79
79 -
 80
80 -
 81
81 -
82
-
83
-
84
-
85
-
86
-
87
-
88
-
89
-
90
-
91
-
92
-
93
-
94
-
95
-
96
-
97
-
98
-
99
-
100
-
101
-
102
-
103
-
104
-
105
-
106
-
107
-
108
-
109
-
110
-
111
-
112
-
113
-
114
-
115
-
116
 |
 |

67
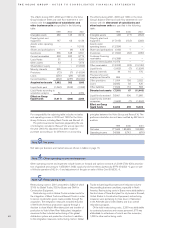
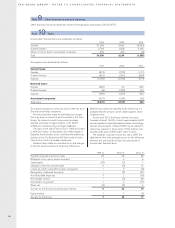
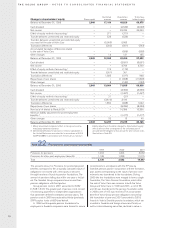
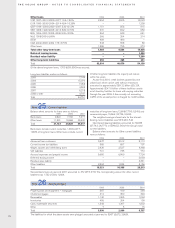
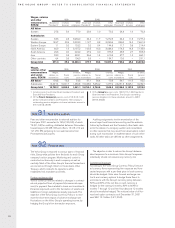
Changes in the Volvo Group’s holdings
of shares and participations: 1999 2000 2001
Balance sheet, December 31, preceding year 3,393 29,213 30,481
Acquisitions and divestments, net 25,550 1,641 (2,844)
New issue of shares and shareholders’ contributions 199 122 94
Share of income in associated companies, after tax 253 208 8
Dividends (133) (741) (74)
Write-downs (30) (60) (11)
Translation differences (30) 92 97
Other 11 6 47
Balance sheet, December 31 29,213 30,481 27,798
The Volvo Group has transactions with some of its
associated companies. As of December 31, 2001, the
Group’s net receivables from associated companies
amounted to 31 (358; 820).
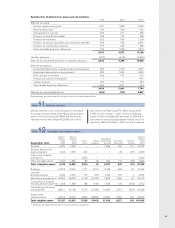
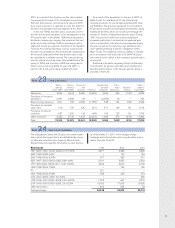
The market value of Volvo’s holdings of shares and
participations in listed companies as of December 31,
2001 is shown in the table below. No write-downs have
been deemed necessary since the deficits are not con-
sidered permanent.
Book value Market value
Scania AB 24,051 17,403
Bilia AB 679 804
Deutz AG 670 102
Henlys Group 524 156
Total holdings
in listed companies 25,924 18,465
Holdings in non-
listed companies 1,874 –
Total shares and
participations 27,798
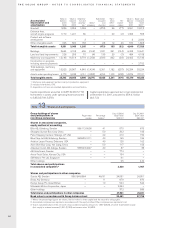
Mitsubishi Motors Corporation (MMC)
In 1999, an agreement was signed between Volvo and
Mitsubishi Motors Corporation, whereby Volvo acquired
shares corresponding to 5% of the votes and capital in
Mitsubishi Motors. In 2001, Volvo divested its holding
and all rights and obligations relating to MMC, which
resulted in a capital gain of 574, net of termination costs
of 194.
AB Volvofinans
In 2001, Volvo divested its entire holding in Volvofinans
for a total purchase price of 871 and with a capital gain
of 61.
Arrow Truck Sales
In 2001, Volvo increased its holding to 100% and Arrow
thereby became a subsidiary of Volvo.
SM Motors Pte Ltd
In 2001, Volvo divested its entire holding in SM Motors
with a capital loss of 13.
Shanghai Sunwin Bus Corporation
In 2000, Volvo and the Chinese vehicle manufacturer,
Shanghai Automotive Industry Corporation, signed
agreeements covering establishment in Shanghai of a
joint-venture company, Shanghai Sunwin Bus
Corporation, for the manufacture and sale of city and
commuter buses. Each party will own 50% of the new
company.
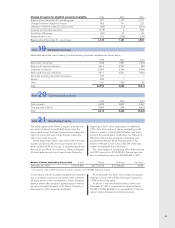
Scania AB
During 1999, Volvo acquired 43.5% of the capital and
28.6% of the voting rights in Scania, one of the world’s
leading manufacturers of trucks and buses. As from
December 2000, Volvo’s holding in Scania is 45.5% of
the capital and 30.6% of the voting rights.
Petro Stopping Centers Holding LP
In 1999, Volvo acquired 28.7% of the truck-stop chain
Petro Stopping Centers in the U.S. This expanded ser-
vice to Volvo’s truck customers along the interstate net-
work in the U.S., offering preventative maintenance,
spare parts sales, emergency road service and minor
repairs.
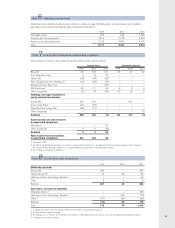
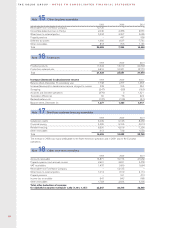
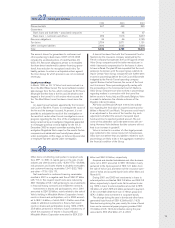
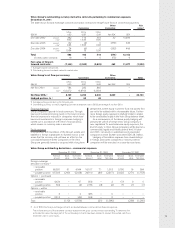
1999 2000 2001
Installment credits 9,115 12,115 13,668
Financial leasing 8,581 10,082 11,534
Other receivables 121 712 873
Total 17,817 22,909 26,075
The increase in 2000 was mainly attributable to the North American operations, while the increase in 2001 also was
attributable to other markets.
Note 14 Long-term customer-financing receivables