Volvo 2001 Annual Report Download - page 15
Download and view the complete annual report
Please find page 15 of the 2001 Volvo annual report below. You can navigate through the pages in the report by either clicking on the pages listed below, or by using the keyword search tool below to find specific information within the annual report.-
 1
1 -
2
-
3
-
4
-
 5
5 -
 6
6 -
 7
7 -
 8
8 -
 9
9 -
 10
10 -
 11
11 -
 12
12 -
 13
13 -
 14
14 -
 15
15 -
 16
16 -
 17
17 -
 18
18 -
 19
19 -
 20
20 -
 21
21 -
 22
22 -
 23
23 -
 24
24 -
 25
25 -
26
-
27
-
28
-
29
-
30
-
31
-
32
-
33
-
34
-
35
-
36
-
37
-
38
-
39
-
40
-
41
-
42
-
43
-
44
-
45
-
46
-
47
-
48
-
49
-
50
-
51
-
52
-
53
-
54
-
55
-
56
-
57
-
58
-
59
-
60
-
61
-
62
-
63
-
64
-
65
-
66
-
67
-
68
-
69
-
70
-
71
-
72
-
73
-
74
-
75
-
76
-
77
-
78
-
79
-
80
-
81
-
82
-
83
-
84
-
85
-
86
-
87
-
88
-
89
-
90
-
91
-
92
-
93
-
94
-
95
-
96
-
97
-
98
-
99
-
100
-
101
-
102
-
103
-
104
-
105
-
106
-
107
-
108
-
109
-
110
-
111
-
112
-
113
-
114
-
115
-
116
 |
 |

11
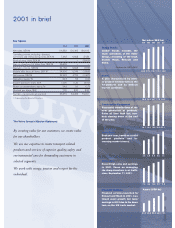
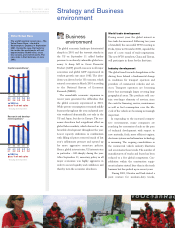
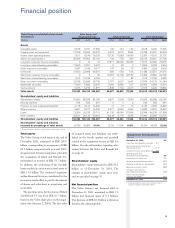
Financial targets
In order to achieve the strategy for growth
and wanted position in 2005, as well as a
competitive return to the shareholders,
Volvo has set a number of financial targets to
support the targeted strategic direction.
These financial targets cover growth, operat-
ing margin, return on equity and capital
structure. The financial targets are set over a
business cycle.
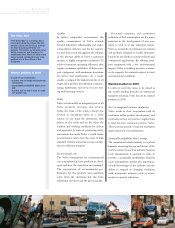
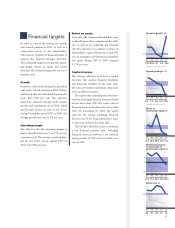
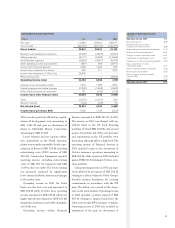
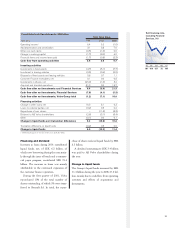
Growth
In order to achieve the strategy for growth as
well as the wanted position in 2005, Volvo’s
ambition is that net sales should increase by
more than 10% per year. The objective
should be achieved through both organic
growth and acquisitions. As of 2001, Mack
and Renault Trucks are part of the Volvo
Group. During the period 1997 to 2001, the
average growth rate was 21.8% per year.
Operating margin
The objective for the operating margin is
that it should be between 5 and 7% over an
economic cycle. The average operating mar-
gin for the Volvo Group during 1997 to
2001 was 5.8% per year.
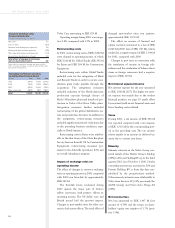
Return on equity
Over time, the return on shareholders’ equi-
ty should more than compensate for infla-
tion as well as for industrial and financial
risk. The objective is to achieve a return on
shareholders’ equity of between 12 and 15%
over an economic cycle. Return on sharehold-
ers’ equity during 1997 to 2001 averaged
13.7% per year.
Capital structure
The Group’s objective is to have a capital
structure that enables financial flexibility
and long-term stability. At the same time,
the aim is to conduct operations using capi-
tal in an efficient manner.
The equity ratio, including minority inter-
ests but excluding Financial Services, should
not be lower than 40%. The equity ratio in
Financial Services should not be lower than
10%. On December 31, 2001, the equity
ratio for the Group, excluding Financial
Services was 41.8%. Financial Services’ equi-
ty ratio was 10.3% at the same date.
The Group’s objective is also to maintain
a net financial position ratio, excluding
Financial Services, between a net financial
assets position of 15% and a net debt posi-
tion of 30%.
0
5
7
97 98 99 00 01
9.6 7.9 6.4 5.5 (0.4)
* Excluding divested operations
Operating margin* %
97 98 99 00 01
Equity ratio, %
53 51 67 61 42
40
97 98 99 00 01
Net financial position
as percentage of
shareholders’ equity, %
27.0 17.4 29.3 10.6 (8.2)
15
–30
0
97 98 99 00 01
Return on
shareholders equity, %
17.2 13.0 34.9 5.0 (1.7)
12
15
0
97 98 99 00 01
Net sales growth*, %
24.0 23.5 8.1 3.4 50.0
* Excluding divested operations
10