Volvo 2001 Annual Report Download - page 59
Download and view the complete annual report
Please find page 59 of the 2001 Volvo annual report below. You can navigate through the pages in the report by either clicking on the pages listed below, or by using the keyword search tool below to find specific information within the annual report.-
 1
1 -
2
-
3
-
4
-
5
-
6
-
7
-
8
-
9
-
10
-
11
-
12
-
13
-
14
-
15
-
16
-
17
-
18
-
19
-
20
-
21
-
22
-
23
-
24
-
25
-
26
-
27
-
28
-
29
-
30
-
31
-
32
-
33
-
34
-
35
-
36
-
37
-
38
-
39
-
40
-
41
-
42
-
43
-
44
-
45
-
46
-
47
-
48
-
 49
49 -
 50
50 -
 51
51 -
 52
52 -
 53
53 -
 54
54 -
 55
55 -
 56
56 -
 57
57 -
 58
58 -
 59
59 -
 60
60 -
 61
61 -
 62
62 -
 63
63 -
 64
64 -
 65
65 -
 66
66 -
 67
67 -
 68
68 -
 69
69 -
70
-
71
-
72
-
73
-
74
-
75
-
76
-
77
-
78
-
79
-
80
-
81
-
82
-
83
-
84
-
85
-
86
-
87
-
88
-
89
-
90
-
91
-
92
-
93
-
94
-
95
-
96
-
97
-
98
-
99
-
100
-
101
-
102
-
103
-
104
-
105
-
106
-
107
-
108
-
109
-
110
-
111
-
112
-
113
-
114
-
115
-
116
 |
 |
55
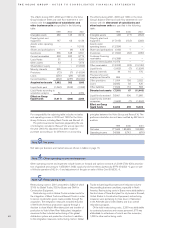
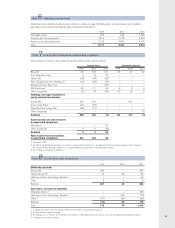
SEK M December 31, 1999 December 31, 2000 December 31, 2001
Assets
Non-current assets
Intangible assets Note 12 6,618 6,925 17,525
Tangible assets Note 12
Property, plant and equipment 19,788 22,231 33,234
Assets under operating leases 12,337 32,125 14,216 36,447 27,101 60,335
Financial fixed assets
Shares and participations Note 13 29,213 30,481 27,798
Long-term customer-financing receivables Note 14 17,817 22,909 26,075
Other long-term receivables Note 15 20,089 67,119 7,264 60,654 14,456 68,329
Total non-current assets 105,862 104,026 146,189
Current assets
Inventories Note 16 21,438 23,551 31,075
Short-term receivables
Customer-financing receivables Note 17 16,496 18,882 22,709
Other receivables Note 18 22,547 39,043 38,316 57,198 33,569 56,278
Marketable securities Note 19 20,956 9,568 13,514
Cash and bank accounts Note 20 8,313 6,400 13,869
Total current assets 89,750 96,717 114,736
Total assets 195,612 200,743 260,925
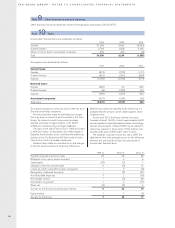
Shareholders’ equity and liabilities
Shareholders’ equity Note 21
Restricted equity
Share capital 2,649 2,649 2,649
Restricted reserves 12,553 15,202 13,804 16,453 12,297 14,946
Unrestricted equity
Unrestricted reserves 50,268 67,176 71,706
Net income (loss) 32,222 82,490 4,709 71,885 (1,467) 70,239
Total shareholders’ equity 97,692 88,338 85,185
Minority interests Note 11 544 593 391
Provisions
Provisions for post-employment benefits Note 22 2,130 2,632 14,647
Provisions for deferred taxes 2,218 2,264 1,044
Other provisions Note 23 12,614 16,962 12,676 17,572 17,383 33,074
Non-current liabilities Note 24
Bond loans 24,238 30,872 30,715
Other loans 7,984 9,533 14,036
Other long-term liabilities 292 32,514 265 40,670 9,379 54,130
Current liabilities Note 25
Loans 21,123 25,828 36,817
Trade payables 11,456 11,377 23,115
Other current liabilities 15,321 47,900 16,365 53,570 28,213 88,145
Total shareholders’ equity and liabilities 195,612 200,743 260,925
Assets pledged Note 26 3,930 2,990 3,737
Contingent liabilities Note 27 6,666 6,789 10,441
Consolidated balance sheets