Volvo 2001 Annual Report Download - page 114
Download and view the complete annual report
Please find page 114 of the 2001 Volvo annual report below. You can navigate through the pages in the report by either clicking on the pages listed below, or by using the keyword search tool below to find specific information within the annual report.-
 1
1 -
2
-
3
-
4
-
5
-
6
-
7
-
8
-
9
-
10
-
11
-
12
-
13
-
14
-
15
-
16
-
17
-
18
-
19
-
20
-
21
-
22
-
23
-
24
-
25
-
26
-
27
-
28
-
29
-
30
-
31
-
32
-
33
-
34
-
35
-
36
-
37
-
38
-
39
-
40
-
41
-
42
-
43
-
44
-
45
-
46
-
47
-
48
-
49
-
50
-
51
-
52
-
53
-
54
-
55
-
56
-
57
-
58
-
59
-
60
-
61
-
62
-
63
-
64
-
65
-
66
-
67
-
68
-
69
-
70
-
71
-
72
-
73
-
74
-
75
-
76
-
77
-
78
-
79
-
80
-
81
-
82
-
83
-
84
-
85
-
86
-
87
-
88
-
89
-
90
-
91
-
92
-
93
-
94
-
95
-
96
-
97
-
98
-
99
-
100
-
101
-
102
-
103
-
 104
104 -
 105
105 -
 106
106 -
 107
107 -
 108
108 -
 109
109 -
 110
110 -
 111
111 -
 112
112 -
 113
113 -
 114
114 -
 115
115 -
 116
116
 |
 |

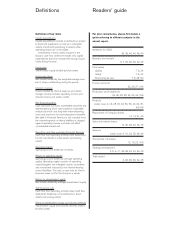
Definitions
Definition of key ratios
Capital expenditures
Capital expenditures include investments in proper-
ty, plant and equipment, as well as in intangible
assets. Investments pertaining to assets under
operating leases are not included.
Investments in fixed assets included in the
Group’s cash flow statement include only capital
expenditures that have reduced the Group’s liquid
funds during the year.
Equity ratio
Shareholders’ equity divided by total assets.
Income per share
Net income divided by the weighted average num-
ber of shares outstanding during the period.
Interest coverage
Income divided by interest expense and similar
charges. Income includes operating income and
interest income and similar credits.
Net financial position
Cash and bank accounts, marketable securities and
interest-bearing short- and long-term receivables
reduced by short- and long-term interest-bearing
loans and provisions for post-employment benefits.
Net debt in Financial Services is not included since
the interest expense on these liabilities is charged
against operating income and does not affect
consolidated interest net.
Operating cash flow, excluding Financial Services
Cash flow from operating activities with deductions
for net investments in fixed assets and leasing
assets.
Operating margin
Operating income divided by net sales.
Return on operating capital
Operating income divided by average operating
capital. Operating capital consists of operating
assets (tangible and intangible assets, receivables
and inventories) reduced by non interest-bearing
current liabilities. This ratio is used only for Volvo’s
business areas, not for the Group as a whole.
Return on shareholders’ equity
Net income divided by average shareholders’ equity.
Self-financing ratio
Cash flow from operating activities (see Cash flow
statement) divided by net investments in fixed
assets and leasing assets.
Share of shareholders’ equity and minority interests
Shareholders’ equity and minority interests divided
by total assets.
Readers’ guide
For your convenience, please find below a
guide referring to different subjects in the
annual report.
Ambitions for 2002
35, 38, 40, 44, 46, 49
Business environment
6, 7, 34, 36, 39, 42, 45
Core values
Quality 7, 8, 24
Safety 7, 8, 24
Environmental care 7, 8, 28–30
Human resources
22, 26, 27, 106
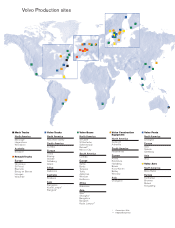
Production and investments
20, 30, 35, 38, 40, 44, 46, 108
Products
inside cover, 4, 24, 28, 32, 34, 36, 39, 40, 42, 45,
48,108
Repurchase of Company shares
12, 14, 21, 69
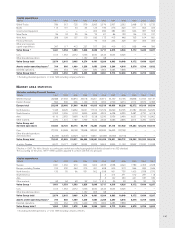
Sales and market shares
16, 35, 38, 40, 44, 45
Services
inside cover, 9, 10, 24, 25, 48, 49
Shareholder information
12, 13, 22, 103
Strategic development
4, 5, 6–11, 35, 38, 40, 44, 46, 49
Total market
4, 34, 36, 39, 42, 45