Volvo 2001 Annual Report Download - page 67
Download and view the complete annual report
Please find page 67 of the 2001 Volvo annual report below. You can navigate through the pages in the report by either clicking on the pages listed below, or by using the keyword search tool below to find specific information within the annual report.-
 1
1 -
2
-
3
-
4
-
5
-
6
-
7
-
8
-
9
-
10
-
11
-
12
-
13
-
14
-
15
-
16
-
17
-
18
-
19
-
20
-
21
-
22
-
23
-
24
-
25
-
26
-
27
-
28
-
29
-
30
-
31
-
32
-
33
-
34
-
35
-
36
-
37
-
38
-
39
-
40
-
41
-
42
-
43
-
44
-
45
-
46
-
47
-
48
-
49
-
50
-
51
-
52
-
53
-
54
-
55
-
56
-
 57
57 -
 58
58 -
 59
59 -
 60
60 -
 61
61 -
 62
62 -
 63
63 -
 64
64 -
 65
65 -
 66
66 -
 67
67 -
 68
68 -
 69
69 -
 70
70 -
 71
71 -
 72
72 -
 73
73 -
 74
74 -
 75
75 -
 76
76 -
 77
77 -
78
-
79
-
80
-
81
-
82
-
83
-
84
-
85
-
86
-
87
-
88
-
89
-
90
-
91
-
92
-
93
-
94
-
95
-
96
-
97
-
98
-
99
-
100
-
101
-
102
-
103
-
104
-
105
-
106
-
107
-
108
-
109
-
110
-
111
-
112
-
113
-
114
-
115
-
116
 |
 |

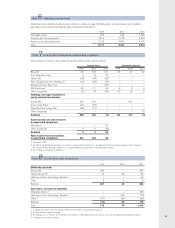
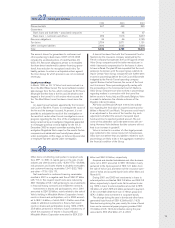
63
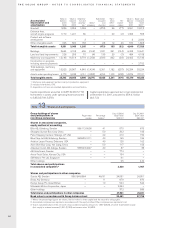
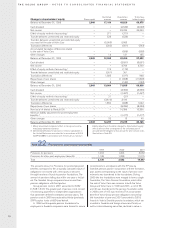
Volvo’s share of income in associated companies before taxes, is shown below:
Income (loss) Dividends received
1999 2000 2001 1999 2000 2001
Bilia AB 89 120 151 35 41 42
Xian Silver Bus Corp 4 13 27 – – –
Turbec AB (22) (44) (67) – – –
Petro Stopping Centers Holding LP (13) (46) (73) – – –
Shanghai Sunwin Bus Corp – – (31) – – –
AB Volvofinans189 111 46 8 8 9
Other companies (2) 33 (55) 90 55 8
Holdings no longer reported as
equity method investments
Scania AB 2467 341 – – 637 –
Arrow Truck Sales 3(21) (76) ––––
OmniNova Technology AB 3(26) (17) ––––
Other companies –––––15
Subtotal 565 435 (2) 133 741 74
Gains (losses) on sale of shares
in associated companies
Volvofinans – – 61
Other companies 2 9 (9)
Subtotal 2 9 52
Total income from investments
in associated companies 567 444 50
1 Divested in 2001
2 On March 14, 2000 the European Commission rejected Volvo’s application for approval of Volvo’s proposed acquisition of Scania.
As a result, Volvo’s holding in Scania is no longer reported in accordance with the equity method.
3 From 2001 a subsidiary of AB Volvo
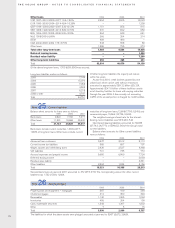
1999 2000 2001
Dividends received
Scania AB 1180 – 637
Henlys Group Plc 13 23 25
Holdings of Volvo Technology Transfer 2––26
Other 8 3 6
Subtotal 201 26 694
Gain (loss) on sales of securities
Mitsubishi Motors 3––768
Holdings of Volvo Technology Transfer 2–105 (10)
Other 4(31) (61) (42)
Subtotal (31) 44 716
Total 170 70 1,410
1In 2000 accounted for by the equity method and included in associated companies.
2A Volvo venture-capital company.
3Excluding costs of 194 for terminating the distribution of Mitsubishi Canter as well as costs for terminated development projects.
4Including write-down of shares
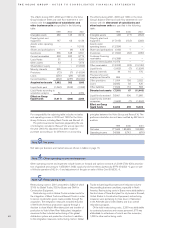
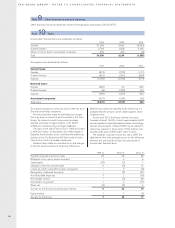
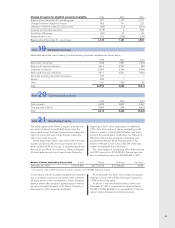
Note 8Income from other investments
1999 2000 2001
Intangible assets 525 648 1,265
Property, plant and equipment 2,514 2,733 4,545
Assets under operating leases 2,132 2,870 4,151
Total 5,171 6,251 9,961
Operating income (loss) by business area is shown in a table on page 16. Depreciation and amortization are included in
operating income and are specified by type of asset as shown below:
Note 6Operating income (loss)
Note 7Income from investments in associated companies