Volvo 2001 Annual Report Download - page 20
Download and view the complete annual report
Please find page 20 of the 2001 Volvo annual report below. You can navigate through the pages in the report by either clicking on the pages listed below, or by using the keyword search tool below to find specific information within the annual report.-
 1
1 -
2
-
3
-
4
-
5
-
6
-
7
-
8
-
9
-
 10
10 -
 11
11 -
 12
12 -
 13
13 -
 14
14 -
 15
15 -
 16
16 -
 17
17 -
 18
18 -
 19
19 -
 20
20 -
 21
21 -
 22
22 -
 23
23 -
 24
24 -
 25
25 -
 26
26 -
 27
27 -
 28
28 -
 29
29 -
 30
30 -
31
-
32
-
33
-
34
-
35
-
36
-
37
-
38
-
39
-
40
-
41
-
42
-
43
-
44
-
45
-
46
-
47
-
48
-
49
-
50
-
51
-
52
-
53
-
54
-
55
-
56
-
57
-
58
-
59
-
60
-
61
-
62
-
63
-
64
-
65
-
66
-
67
-
68
-
69
-
70
-
71
-
72
-
73
-
74
-
75
-
76
-
77
-
78
-
79
-
80
-
81
-
82
-
83
-
84
-
85
-
86
-
87
-
88
-
89
-
90
-
91
-
92
-
93
-
94
-
95
-
96
-
97
-
98
-
99
-
100
-
101
-
102
-
103
-
104
-
105
-
106
-
107
-
108
-
109
-
110
-
111
-
112
-
113
-
114
-
115
-
116
 |
 |

16
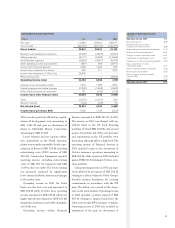
Net sales
Net sales in 2001 totaled SEK 180,615 M
(120,392), an increase of 50% compared
with 2000. Adjusted for acquired companies
and changes in foreign currency exchange
rates, net sales decreased by 5%.
Including Mack and Renault Trucks, net
sales of Volvo’s truck operations nearly doub-
led and amounted to SEK 120,140 M.
Despite the significant decline in deliveries,
Volvo Global Trucks was able to increase its
share of the market in North America. In
Europe, the combined heavy-truck market
share for Volvo and Renault was maintained
at the same level as in 2000, while market
shares increased in the medium-heavy seg-
ment.
Net sales for Volvo CE reached a record
level, in part due to a favorable currency
trend but also as a result of successfully
launched products. Volvo Penta’s sales
remained strong with an increase of 12% in
a declining market. As a result of increasing
sales of components and spare parts for com-
mercial aircraft, Volvo Aero’s net sales rose
by 10%.
During 2001, the Group’s net sales
increased in all market areas compared with
the year-earlier period. Net sales in Western
Europe rose by 50%, most of which was
attributable to the acquisition of Renault
Trucks. Excluding acquired companies, Group
net sales in Western Europe increased by 2%.
The decline in demand in North America
had an adverse effect on net sales. Excluding
acquired companies Group net sales in
North America declined by 8%. Net sales in
Volvo’s growth markets – Asia, Eastern
Europe and South America – increased by
35% compared with a year earlier and
accounted for 13% of the Group’s total sales.
Excluding Mack and Renault Trucks, net
sales on these markets rose by 19% com-
pared with the preceding year.
During 2001, Western Europe and North
America accounted for 82% of the Group’s
total sales, compared with 83% in the preced-
ing year.The distribution of net sales by mar-
ket is further specified in the adjoining table.
Income from investments in shares
Income from investments in shares for the
year amounted to SEK 1,322 M (411),
attributable mainly to a dividend received
from Scania and a capital gain from the
divestment of shares in Mitsubishi Motors.
Income from investments in shares during
2000 included income from the investment
in Scania reported in accordance with the
equity method during the first quarter. In
March 2000, the European Commission
rejected Volvo’s application for approval of
the proposed acquisition of Scania. As a
result, effective in the second quarter of
2000, Volvo’s holding in Scania is no longer
reported in accordance with the equity
method.
Operating income
Operating loss for the Volvo Group in 2001
amounted to SEK 676 M, compared with
operating income of SEK 6,668 M in the
preceding year. The decrease in income was
mainly attributable to restructuring costs of
SEK 3,862 M and losses in the North
American operations partially offset by capi-
talization of development costs of SEK
2,038 M in accordance with new Swedish
accounting standards.
Global Trucks’ operating income in 2001,
excluding restructuring costs, amounted to
SEK 1,040 M (2000: Volvo Trucks operating
income of SEK 1,414 M). The earnings of
Global Trucks was negatively affected by
lower volumes and low capacity utilization
in North America. Total deliveries in North
America decreased by 40% compared with a
year earlier. In Western Europe, the total
market showed gradual weakening during
the year and the number of trucks delivered
was down by 9%. The integration of Renault
Trucks and Mack Trucks succeeded in line
with the plan and contributed positively to
the result. The income of Global Trucks in
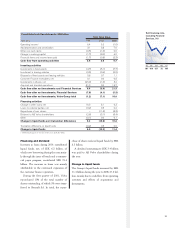
Financial performance
Net sales by market area
SEKM 1999 2000 2001 %1
Western Europe 59,858 61,942 93,147 +50
Eastern Europe 2,714 3,676 6,383 +74
North America 41,382 38,029 54,630 +44
South America 3,487 4,730 6,018 +27
Asia 6,027 8,765 10,862 +24
Other markets 2,914 3,250 9,575 +195
Volvo Group 116,382 120,392 180,615 +50
1Percentage change pertains to 2001/2000.
Operating margin1
%1999 2000 2001
Global Trucks25.2 2.3 0.9
Buses 1.5 2.6 (3.1)
Construction Equipment 9.1 8.0 4.2
Volvo Penta 5.5 7.3 8.9
Volvo Aero 5.9 5.8 5.5
Volvo Group 6.4 5.5 1.8
1Excluding income from sale of Volvo Cars and restructuring
costs
21999 and 2000 refer to Volvo Trucks
Net sales by business area
SEKM 1999 2000 2001 %2
Global Trucks163,010 62,196 120,140 +93
Buses 14,713 17,187 16,675 (3)
Construction
Equipment 18,882 19,993 21,135 +6
Volvo Penta 5,761 6,599 7,380 +12
Volvo Aero 9,953 10,713 11,784 +10
Other 11,934 12,669 13,630 +8
Eliminations (7,871) (8,965) (10,129) –
Volvo Group 3116,382 120,392 180,615 +50
11999 and 2000 figures refer to Volvo Trucks.
2Percentage change pertains to 2001/2000.
3Excluding acquired companies and changes in foreign
currencies’ exchange rates, net sales decreased by 5%.
Operating income (loss) by
business area
SEKM 1999 2000 2001
Global Trucks13,247 1,414 1,040
Buses 224 440 (524)
Construction
Equipment 1,709 1,594 891
Volvo Penta 314 484 658
Volvo Aero 584 621 653
Financial Services 1,066 1,499 325
Other 319 616 143
Operating income 27,463 6,668 3,186
Income from divestment
of Volvo Cars 26,695 – –
Restructuring costs – – (3,862)
Operating income
(loss) 34,158 6,668 (676)
11999 and 2000, Volvo Trucks.
2Excluding income from sale of Volvo Cars and restructur-
ing costs.
THE VOLVO GROUP YEAR 2001