Volvo 2001 Annual Report Download - page 25
Download and view the complete annual report
Please find page 25 of the 2001 Volvo annual report below. You can navigate through the pages in the report by either clicking on the pages listed below, or by using the keyword search tool below to find specific information within the annual report.-
 1
1 -
2
-
3
-
4
-
5
-
6
-
7
-
8
-
9
-
10
-
11
-
12
-
13
-
14
-
 15
15 -
 16
16 -
 17
17 -
 18
18 -
 19
19 -
 20
20 -
 21
21 -
 22
22 -
 23
23 -
 24
24 -
 25
25 -
 26
26 -
 27
27 -
 28
28 -
 29
29 -
 30
30 -
 31
31 -
 32
32 -
 33
33 -
 34
34 -
 35
35 -
36
-
37
-
38
-
39
-
40
-
41
-
42
-
43
-
44
-
45
-
46
-
47
-
48
-
49
-
50
-
51
-
52
-
53
-
54
-
55
-
56
-
57
-
58
-
59
-
60
-
61
-
62
-
63
-
64
-
65
-
66
-
67
-
68
-
69
-
70
-
71
-
72
-
73
-
74
-
75
-
76
-
77
-
78
-
79
-
80
-
81
-
82
-
83
-
84
-
85
-
86
-
87
-
88
-
89
-
90
-
91
-
92
-
93
-
94
-
95
-
96
-
97
-
98
-
99
-
100
-
101
-
102
-
103
-
104
-
105
-
106
-
107
-
108
-
109
-
110
-
111
-
112
-
113
-
114
-
115
-
116
 |
 |
21
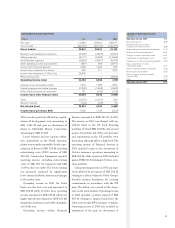
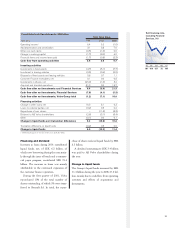
Financing and dividend
Increases in loans during 2001 contributed
liquid funds, net, of SEK 6.2 billion, of
which new borrowing during the year, main-
ly through the issue of bonds and a commer-
cial paper program, contributed SEK 31.4
billion. The increase in loans was mainly
attributable to the continued expansion of
the customer finance operation.
During the first quarter of 2001, Volvo
repurchased 10% of the total number of
shares outstanding, of which 5% were trans-
ferred to Renault SA. In total, the repur-
chase of shares reduced liquid funds by SEK
8.3 billion.
A dividend amounting to SEK 3.4 billion
was paid to AB Volvo shareholders during
the year.
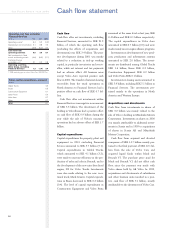
Change in liquid funds
The Group’s liquid funds increased by SEK
11.4 billion during the year, to SEK 27.4 bil-
lion, mainly due to cash flow from operating
activities and effects of acquisitions and
divestments.
97 98 99 00 01
Self-financing ratio,
excluding Financial
Services, (%)
181 108 127 72 137
Consolidated cash flow statements, SEK billion
Total Volvo Group
SEK billion 1999 2000 2001
Operating income 1 6.4 5.2 (1.0)
Add depreciation and amortization 3.1 3.8 7.0
Other non-cash items (0.5) (1.6) 0.0
Change in working capital (1.7) (3.0) 6.0
Financial items and income taxes paid (1.7) (0.8) (2.3)
Cash flow from operating activities 5.6 3.6 9.7
Investing activities
Investments in fixed assets (4.7) (5.1) (7.7)
Investment in leasing vehicles (0.5) (0.6) (0.5)
Disposals of fixed assets and leasing vehicles 0.8 0.7 1.1
Customer Finance receivables, net 0.1 0.0 0.8
Investments in shares, net (25.9) (1.6) 3.2
Acquired and divested operations 31.0 0.0 14.7
Cash flow after net investments excl Financial Services 6.4 (3.0) 21.3
Cash flow after net investments, Financial Services (7.6) (4.1) (5.3)
Cash flow after net investments, Volvo Group total (1.2) (7.1) 16.0
Financing activities
Change in other loans, net 16.3 8.1 6.2
Loans to external parties, net (3.2) 0.3 0.2
Repurchase of own shares – (11.8) (8.3)
Dividend to AB Volvo shareholders (2.6) (3.1) (3.4)
Other (0.1) 0.0 0.1
Change in liquid funds excl translation differences 9.2 (13.6) 10.8
Translation difference on liquid funds (0.2) 0.3 0.6
Change in liquid funds 9.0 (13.3) 11.4
1 1999: Excluding gain on the sale of Volvo Cars, SEK 26.7 billion.