Volvo 2001 Annual Report Download - page 80
Download and view the complete annual report
Please find page 80 of the 2001 Volvo annual report below. You can navigate through the pages in the report by either clicking on the pages listed below, or by using the keyword search tool below to find specific information within the annual report.-
 1
1 -
2
-
3
-
4
-
5
-
6
-
7
-
8
-
9
-
10
-
11
-
12
-
13
-
14
-
15
-
16
-
17
-
18
-
19
-
20
-
21
-
22
-
23
-
24
-
25
-
26
-
27
-
28
-
29
-
30
-
31
-
32
-
33
-
34
-
35
-
36
-
37
-
38
-
39
-
40
-
41
-
42
-
43
-
44
-
45
-
46
-
47
-
48
-
49
-
50
-
51
-
52
-
53
-
54
-
55
-
56
-
57
-
58
-
59
-
60
-
61
-
62
-
63
-
64
-
65
-
66
-
67
-
68
-
69
-
 70
70 -
 71
71 -
 72
72 -
 73
73 -
 74
74 -
 75
75 -
 76
76 -
 77
77 -
 78
78 -
 79
79 -
 80
80 -
 81
81 -
 82
82 -
 83
83 -
 84
84 -
 85
85 -
 86
86 -
 87
87 -
 88
88 -
 89
89 -
 90
90 -
91
-
92
-
93
-
94
-
95
-
96
-
97
-
98
-
99
-
100
-
101
-
102
-
103
-
104
-
105
-
106
-
107
-
108
-
109
-
110
-
111
-
112
-
113
-
114
-
115
-
116
 |
 |

THE VOLVO GROUP · NOTES TO CONSOLIDATED FINANCIAL STATEMENTS
76
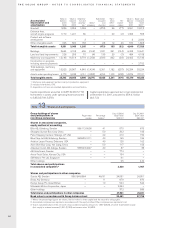
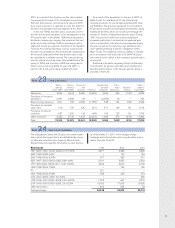
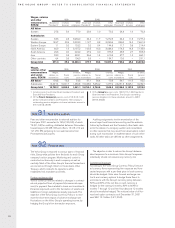
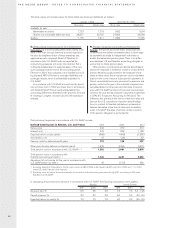
Wages, salaries
and other 1999 2000 2001
remunerations, Board and of which, Other Board and of which, Other Board and of which, Other
SEK M Presidents1bonuses employees Presidents1bonuses employees Presidents1bonuses employees
AB Volvo
Sweden 27.8 5.9 77.0 23.9 1.0 73.2 24.4 1.9 70.3
Subsidiaries
Sweden 63.3 9.3 6,969.0 64.4 11.7 7,272.5 64.4 11.3 7,277.4
Western Europe 149.7 20.9 3,203.0 112.7 8.8 3,290.6 356.0 14.2 7,661.3
Eastern Europe 1.1 0.2 102.2 3.2 0.4 144.8 11.7 3.8 214.4
North America 60.9 1.9 3,137.2 103.5 16.3 3,484.6 174.5 14.3 7,135.9
South America 29.6 0.0 292.9 27.9 0.0 376.5 48.5 2.7 355.3
Asia 33.0 0.5 493.1 36.6 1.4 610.5 47.7 1.2 660.1
Other countries 6.4 0.5 106.0 5.5 – 134.7 13.0 – 231.1
Group total 371.8 39.2 14,380.4 377.7 39.6 15,387.4 740.2 49.4 23,605.8
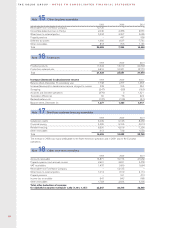
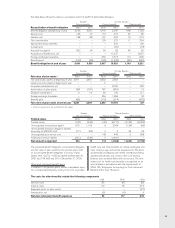
Wages,
salaries other 1999 2000 2001
remunerations Wages, of which, Wages, of which, Wages, of which,
and social- salaries, re- Social pension salaries, re- Social pension salaries, re- Social pension
costs, SEK M munerations costs costs munerations costs costs munerations costs costs
AB Volvo 2104.8 78.5 54.3 97.1 90.4 70.3 94.7 111.9 92.5
Subsidiaries 14,647.4 5,001.7 1,486.8 15,668.0 5,654.2 1,477.9 24,251.3 8,995.1 3,239.7
Group total 314,752.2 5,080.2 1,541.1 15,765.1 5,744.6 1,548.2 24,346.0 9,107.0 3,332.2
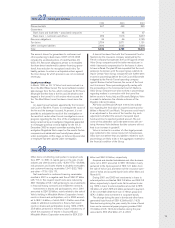
The Volvo Group is exposed to various types of financial
risks. Group-wide policies form the basis for each Group
company’s action program. Monitoring and control is
conducted continuously in each company as well as
centrally. Most of the Volvo Group’s financial transactions
are carried out through Volvo’s in-house bank, Volvo
Treasury, which conducts its operations within
established risk mandates and limits.
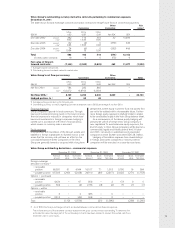
Foreign exchange risks
Volvo’s currency risks are related to changes in contract-
ed and projected flows of payments (commercial expo-
sure), to payment flows related to loans and investments
(financial exposure), and to the translation of assets and
liabilities in foreign subsidiaries (equity exposure). The
objective of the Volvo Group Currency Policy is to mini-
mize the short-term impact of adverse exchange rate
fluctuations on the Volvo Group’s operating income, by
hedging the Group’s firm transaction exposure.
The objective is also to reduce the Group’s balance
sheet exposure to a minimum. Volvo Group Companies
individually should not assume any currency risk.
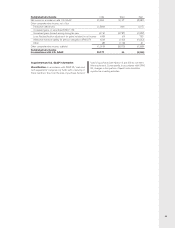
Commercial exposure
According to the Volvo Group Currency Policy, forecast-
ed currency flows representing firm exposure and fore-
casted exposure with a pre-fixed price in local currency
should be hedged. Volvo uses forward exchange con-
tracts and currency options to hedge these flows. In
accordance with the Group’s currency policy, between
50% and 80% of the net flow in each currency is
hedged for the coming 6 months, 30% to 60% for
months 7 through 12 and firm flows beyond 12 months
should normally be hedged. The notional value of all for-
ward and option contracts as of December 31, 2001
was SEK 12.1 billion (16.7; 25.0).
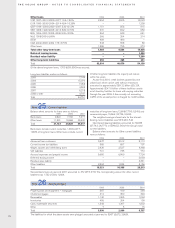
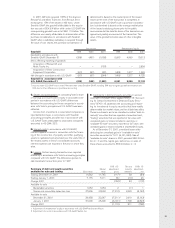
Fees and other remuneration to external auditors for
fiscal year 2001 amounted to 195, (130; 90), of which
74 (51; 55) for auditing, distributed between Pricewater-
houseCoopers, 60 (38; 34) and others, 14 (13; 21), and
121 (79; 35) pertaining to non-audit services from
PricewaterhouseCoopers.
Auditing assignments involve examination of the
annual report and financial accounting and the adminis-
tration by the Board and the President, other tasks relat-
ed to the duties of a company auditor and consultation
or other services that may result from observations noted
during such examination or implementation of such other
tasks. All other tasks are defined as other assignments.
1 Including current and former Board members, Presidents and
Executive Vice Presidents.
2Of the Parent Company’s pension costs, 21.9 (51.3; 14.6)
pertain to Board members and Presidents. The Company’s
outstanding pension obligations to these individuals amount to
319.1 (301.8; 287.9).
3Of the Group’s pension costs, 100.3 (116.1; 60.0) pertain to
Board members and Presidents. The Group’s outstanding
pension obligations to these individuals amount to 442.3
(397.6; 368.2).
Note 31 Fees to the auditors
Note 32 Financial risks