Volvo 2001 Annual Report Download - page 34
Download and view the complete annual report
Please find page 34 of the 2001 Volvo annual report below. You can navigate through the pages in the report by either clicking on the pages listed below, or by using the keyword search tool below to find specific information within the annual report.-
 1
1 -
2
-
3
-
4
-
5
-
6
-
7
-
8
-
9
-
10
-
11
-
12
-
13
-
14
-
15
-
16
-
17
-
18
-
19
-
20
-
21
-
22
-
23
-
 24
24 -
 25
25 -
 26
26 -
 27
27 -
 28
28 -
 29
29 -
 30
30 -
 31
31 -
 32
32 -
 33
33 -
 34
34 -
 35
35 -
 36
36 -
 37
37 -
 38
38 -
 39
39 -
 40
40 -
 41
41 -
 42
42 -
 43
43 -
 44
44 -
45
-
46
-
47
-
48
-
49
-
50
-
51
-
52
-
53
-
54
-
55
-
56
-
57
-
58
-
59
-
60
-
61
-
62
-
63
-
64
-
65
-
66
-
67
-
68
-
69
-
70
-
71
-
72
-
73
-
74
-
75
-
76
-
77
-
78
-
79
-
80
-
81
-
82
-
83
-
84
-
85
-
86
-
87
-
88
-
89
-
90
-
91
-
92
-
93
-
94
-
95
-
96
-
97
-
98
-
99
-
100
-
101
-
102
-
103
-
104
-
105
-
106
-
107
-
108
-
109
-
110
-
111
-
112
-
113
-
114
-
115
-
116
 |
 |

30
VOLVO IN SOCIETY
approach is shared with all core values –
quality, safety and environment.
A cornerstone in the Volvo environmental
policy is to provide open and factual infor-
mation internally and to our stakeholders.
The information in the annual report is sup-
plemented on the Internet, where detailed
performance data, the Volvo positions and
progress descriptions are provided.
Commitment in the value chain
The environmental aspects of Volvo’s opera-
tions are primarily the emissions from our
products and the production. To manage the
continuous improvement that we promise in
our policy, we use environmental manage-
ment systems in all parts of the value chain,
including both the market organizations and
our suppliers. The progress of obtaining ISO
14001 certificates for our units is steady, and
since Renault Trucks and Mack Trucks are
now included in the Group, new certificates
will be added.
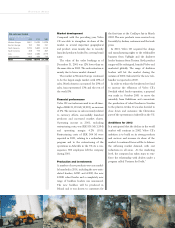
Production and
environment
Global presence, same values,
different conditions
The Volvo Group has production sites on all
continents. The size and conditions of these
sites vary from small-scale production in
Asia to the most modern plants with high
automation in Europe and in North
America. Regardless of size and location, all
production units must comply with our
minimum requirements of environmental
performance and have an on-going improve-
ment program. The requirements include
that energy consumption, waste amounts,
emissions to air and water have to be moni-
tored, as well as specifying maximum emis-
sion levels to air and water. Most plants are
well above the minimum requirements and
show a steady improvement.
Environmental audits
The acquisition of Mack and Renault V.I.
means that 9 new plants are being integrated
in the Volvo Group environmental auditing
and reporting schemes. A thorough due
diligence investigation was performed during
the acquisition process, and action points
were identified. The cooperation with our
new colleagues is proceeding very well, with
mutual learning.
Since 1989, environmental audits have
identified clean-up requirements that have
resulted in corrective measures amounting
to about SEK 52 M. Environmental risk
evaluations of operations are also made in
connection with the environmental audits,
and Volvo has insurance coverage for possible
accidental damage to nearby areas.
Production performance 2001
At the beginning of 2002, Volvo had a total
of 52 plants for the production of trucks,
buses, construction equipment, marine and
industrial power systems, and aircraft
engines, of which 16 in Sweden. All the
plants have the requisite permits, which in
Sweden covers waste, noise and emissions to
air, water and soil. Two Swedish permits are
to be renewed during 2002.
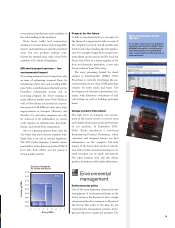
Since 1996 Volvo reports emission and
consumption data in the annual report, and
in a separate detailed report that is available
on Internet. The 2001 data include the new
Renault and Mack plants and can be found
on page 108. Due to a larger Group, all
parameters show increased absolute values
compared to 2000. However, all parameters
but sulfur dioxide and hazardous waste fol-
low a decreasing trend in relation to net
sales. The hazardous waste parameter is very
dependent on changes in national rules, and
sulfur dioxide emissions have increased due
to limited availability of low-sulfur fuels in
the newly acquired production plants.
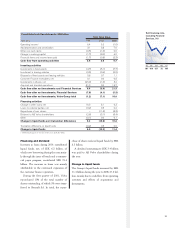
97 98 99 00 01
Energy, TWh
Energy/net sales,
MWh/SEK M
1.7 1.8 1.8 1.7 2.5
19.5 16.5 15.6 13.8 14.0
Energy consumption
97 98 99 00 01
Hazardous waste
10.4 10.8 15.6 17.2 19.8
119 101 134 143 109
■ k ton
■ kg/SEK M
97 98 99 00 01
Emissions, ton
Emissions/net sales,
kg/SEK M
0.9 1.1 1.3 1.4 1.7
10.7 10.0 11.4 11.8 9.7
Solvent emissions
97 98 99 00 01
Water, 1.000 m3
Water/net sales,
m3/SEK M
7.3 5.3 6.7 6.1 9.2
84.0 49.1 57.8 51.0 50.8
Water consumption