Volvo 2001 Annual Report Download - page 23
Download and view the complete annual report
Please find page 23 of the 2001 Volvo annual report below. You can navigate through the pages in the report by either clicking on the pages listed below, or by using the keyword search tool below to find specific information within the annual report.-
 1
1 -
2
-
3
-
4
-
5
-
6
-
7
-
8
-
9
-
10
-
11
-
12
-
 13
13 -
 14
14 -
 15
15 -
 16
16 -
 17
17 -
 18
18 -
 19
19 -
 20
20 -
 21
21 -
 22
22 -
 23
23 -
 24
24 -
 25
25 -
 26
26 -
 27
27 -
 28
28 -
 29
29 -
 30
30 -
 31
31 -
 32
32 -
 33
33 -
34
-
35
-
36
-
37
-
38
-
39
-
40
-
41
-
42
-
43
-
44
-
45
-
46
-
47
-
48
-
49
-
50
-
51
-
52
-
53
-
54
-
55
-
56
-
57
-
58
-
59
-
60
-
61
-
62
-
63
-
64
-
65
-
66
-
67
-
68
-
69
-
70
-
71
-
72
-
73
-
74
-
75
-
76
-
77
-
78
-
79
-
80
-
81
-
82
-
83
-
84
-
85
-
86
-
87
-
88
-
89
-
90
-
91
-
92
-
93
-
94
-
95
-
96
-
97
-
98
-
99
-
100
-
101
-
102
-
103
-
104
-
105
-
106
-
107
-
108
-
109
-
110
-
111
-
112
-
113
-
114
-
115
-
116
 |
 |

19
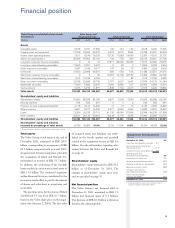
Financial position
Total assets
The Volvo Group’s total assets at the end of
December, 2001, amounted to SEK 260.9
billion, corresponding to an increase of SEK
60.2 billion compared with year-end 2000.
Acquired and divested companies, primarily
the acquisition of Mack and Renault V.I.,
represented an increase of SEK 53.7 billion.
In addition, the weakening of the Swedish
krona resulted in an increase in total assets of
SEK 13.8 billion. The continued expansion
within Financial Services contributed to the
increase in assets offset in part by divestment
of shares and reductions in inventories and
receivables.
The purchase price for the shares of Mack
and Renault V.I. was set at SEK 10.7 billion,
based on the Volvo share price on the acqui-
sition date (January 2, 2001). The fair value
of acquired assets and liabilities was estab-
lished in the fourth quarter and goodwill
related to the acquisition was set at SEK 8.4
billion. See also information regarding arbi-
tration between AB Volvo and Renault SA
on page 14.
Shareholders’ equity
Shareholders’ equity amounted to SEK 85.2
billion as of December 31, 2001. The
changes in shareholders’ equity since year-
end are specified on page 70.
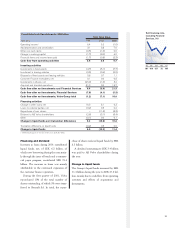
Net financial position
The Volvo Group’s net financial debt at
December 31, 2001 amounted to SEK 7.0
billion (net financial assets of 9.4 billion).
The decrease of SEK 16.4 billion is shown in
detail in the adjoining table.
Volvo Group consolidated balance sheets, Volvo Group, excl
December 31 Financial Services 1Financial Services Total Volvo Group
SEK M 1999 2000 2001 1999 2000 2001 1999 2000 2001
Assets
Intangible assets 6,518 6,781 17,366 100 144 159 6,618 6,925 17,525
Property, plant and equipment 17,318 19,652 30,370 2,470 2,579 2,864 19,788 22,231 33,234
Assets under operating leases 1,611 4,245 15,020 10,726 11,883 14,060 12,337 14,216 27,101
Shares and participations 35,296 37,366 35,145 744 778 203 29,213 30,481 27,798
Long-term customer finance receivables 0 10 19 17,817 23,026 26,256 17,817 22,909 26,075
Long-term interest-bearing receivables 17,605 5,091 5,627 0 23 0 17,605 5,032 5,554
Other long-term receivables 2,337 2,186 9,017 147 90 73 2,484 2,232 8,902
Inventories 21,053 22,998 30,557 385 553 518 21,438 23,551 31,075
Short-term customer finance receivables 9 5 95 16,487 19,168 23,732 16,496 18,882 22,709
Short-term interest bearing receivables 1,012 14,195 6,799 0 1 82 1,012 14,196 2,525
Other short-term receivables 18,738 22,696 29,798 2,797 2,627 2,647 21,535 24,120 31,044
Marketable securities 17,990 5,682 12,997 2,966 3,886 517 20,956 9,568 13,514
Cash and bank 6,475 5,276 11,877 1,838 1,764 2,417 8,313 6,400 13,869
Total assets 145,962 146,183 204,687 56,477 66,522 73,528 195,612 200,743 260,925
Shareholders’ equity and liabilities
Shareholders’ equity 97,692 88,338 85,185 6,827 7,663 7,550 97,692 88,338 85,185
Minority interests 544 593 391 0 0 0 544 593 391
Provision for post-employment benefits 2,118 2,619 14,632 12 13 15 2,130 2,632 14,647
Other provisions 9,861 8,277 14,085 4,971 6,620 4,342 14,832 14,941 18,427
Loans 12,206 18,233 29,710 41,139 49,048 57,956 53,345 66,233 81,568
Other liabilities 23,541 28,123 60,684 3,528 3,178 3,665 27,069 28,006 60,707
Shareholders’ equity and liablities 145,962 146,183 204,687 56,477 66,522 73,528 195,612 200,743 260,925
Shareholders’ equity and minority
interests as percentage of total assets 67.3% 60.8% 41.8% 12.1% 11.5% 10.3% 50.2% 44.3% 32.8%
1 Financial Services reported in accordance with the equity method.
Change in net financial position
SEK billion
December 31, 2000 9.4
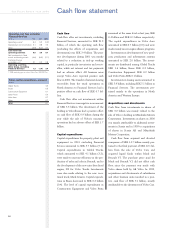
Cash flow from operating activities 9.7
Net investments in fixed assets
and leasing assets (7.1)
Customer finance receivables, net 0.8
Operating cash flow,
excluding Financial Services 3.4
Investments in shares, net 3.2
Acquired and divested operations1(6.7)
Dividend to AB Volvo’s shareholders (3.4)
Repurchase of own shares (8.3)
Change in provision for
post-employment benefits (2.5)
Other, including foreign
currency translation (2.1)
December 31, 2001 (7.0)
1Including purchase amount and financial net debt in
acquired companies. See further Note 2.