Volvo 2001 Annual Report Download - page 76
Download and view the complete annual report
Please find page 76 of the 2001 Volvo annual report below. You can navigate through the pages in the report by either clicking on the pages listed below, or by using the keyword search tool below to find specific information within the annual report.-
 1
1 -
2
-
3
-
4
-
5
-
6
-
7
-
8
-
9
-
10
-
11
-
12
-
13
-
14
-
15
-
16
-
17
-
18
-
19
-
20
-
21
-
22
-
23
-
24
-
25
-
26
-
27
-
28
-
29
-
30
-
31
-
32
-
33
-
34
-
35
-
36
-
37
-
38
-
39
-
40
-
41
-
42
-
43
-
44
-
45
-
46
-
47
-
48
-
49
-
50
-
51
-
52
-
53
-
54
-
55
-
56
-
57
-
58
-
59
-
60
-
61
-
62
-
63
-
64
-
65
-
 66
66 -
 67
67 -
 68
68 -
 69
69 -
 70
70 -
 71
71 -
 72
72 -
 73
73 -
 74
74 -
 75
75 -
 76
76 -
 77
77 -
 78
78 -
 79
79 -
 80
80 -
 81
81 -
 82
82 -
 83
83 -
 84
84 -
 85
85 -
 86
86 -
87
-
88
-
89
-
90
-
91
-
92
-
93
-
94
-
95
-
96
-
97
-
98
-
99
-
100
-
101
-
102
-
103
-
104
-
105
-
106
-
107
-
108
-
109
-
110
-
111
-
112
-
113
-
114
-
115
-
116
 |
 |
THE VOLVO GROUP · NOTES TO CONSOLIDATED FINANCIAL STATEMENTS
72
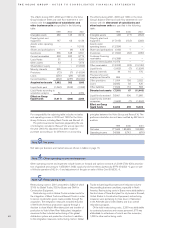
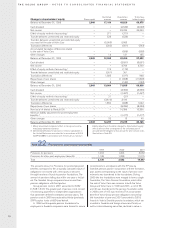
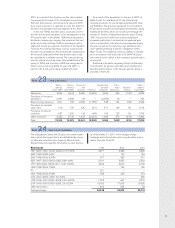
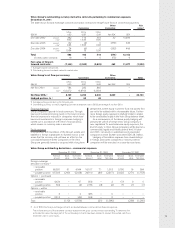
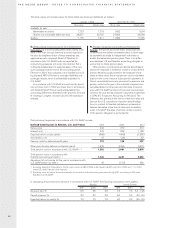
Balance sheet amounts for loans were as follows:
1999 2000 2001
Bank loans 9,822 7,160 7,417
Other loans 11,301 18,668 29,400
Total 21,123 25,828 36,817
maturities of long-term loans,12,608 (7,750; 5,245), and
commercial paper, 15,966 (10,724; 5,526).
The weighted average interest rate for the interest-
bearing current liabilities was 5.4% (6.6; 5.2).
Noninterest-bearing liabilities accounted for 50,935
(27,742; 26,777), or 58% (52; 56) of the Group’s total
current liabilities.
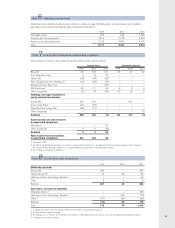
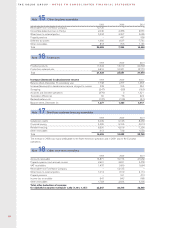
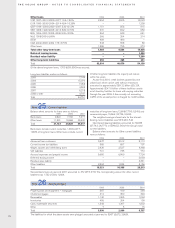
Balance sheet amounts for Other current liabilities
were as follows:
1999 2000 2001
Advances from customers 3,447 3,512 3,112
Current income tax liabilities 569 697 707
Wages, salaries and withholding taxes 2,420 2,527 4,368
VAT liabilities 701 735 772
Accrued expenses and prepaid income 5,680 6,960 7,724
Deferred leasing income – – 2,033
Residual value liability – – 4,341
Other liabilities 2,504 1,934 5,156
Total 15,321 16,365 28,213
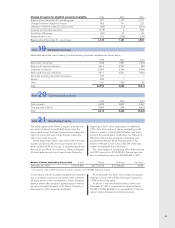
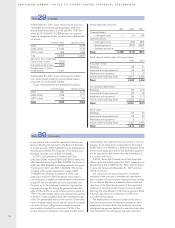
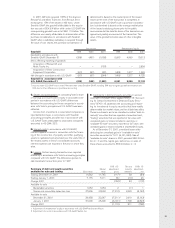
Secured bank loans at year-end 2001 amounted to 472 (473; 415). The corresponding amount for other current
liabilities was 1,732 (1,506; 1,860).
1999 2000 2001
Property, plant and equipment – mortgages 367 109 264
Chattel mortgages 412 350 394
Receivables 1,140 1,065 1,063
Inventories 456 254 199
Cash, marketable securities 1,548 1,207 1,802
Other 7 5 15
Total 3,930 2,990 3,737
The liabilities for which the above assets were pledged amounted at year-end to 3,907 (2,672; 2,865).
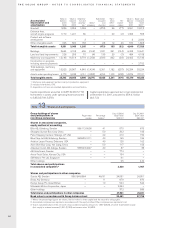
Note 25 Current liabilities
Note 26 Assets pledged
Bank loans include current maturities, 1,484 (2,917;
1,893), of long-term loans. Other loans include current
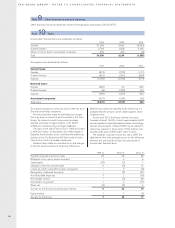
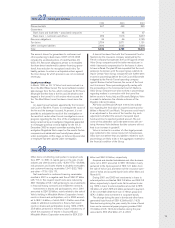
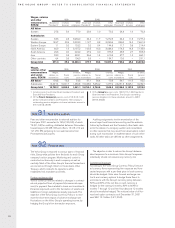
Other loans 1999 2000 2001
USD 1997–2001/2003–2017 1.94–13.0% 2,954 4,905 10,023
EUR 1990–2000/2004–2014 4.84–10.25% – – 1,239
GBP 1994–2000/2003–2007 5.42–8.12% 1,151 858 915
SEK 1988–1999/2003–2013, 3.80–6.15% 631 822 650
BRL 1996–2001/2003–2006 8.29–20.5% 364 849 641
NLG 1998/2004, 6.60% 266 254 214
DEM 489 493 –
CAD 2002/2008–2009 1.75–3.75% 543 558 80
Other loans 1,586 795 274
Total other long-term loans 7,984 9,534 14,036
Deferred leasing income – – 1,898
Residual value liability – – 7,250
Other long-term liabilities 292 265 231
Total 32,514 40,670 54,130
Of the above long-term loans, 1,703 (693; 590) was secured.
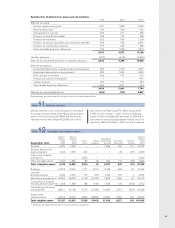
Long-term liabilities mature as follows:
2003 7,144
2004 15,079
2005 7,058
2006 4,505
2007 6,218
2008 or later 4,747
Total 44,751
Of other long-term liabilities the majority will mature
within five years.
At year-end 2001, credit facilities granted but not
utilized and which can be used without restrictions
amounted to approximately SEK 22 billion (23; 20).
Approximately SEK 19 billion of these facilities consist-
ed of stand-by facilities for loans with varying maturities
through the year 2006. A fee normally not exceeding
0.25% of the unused portion is charged for credit facilities.