Volvo 2001 Annual Report Download - page 5
Download and view the complete annual report
Please find page 5 of the 2001 Volvo annual report below. You can navigate through the pages in the report by either clicking on the pages listed below, or by using the keyword search tool below to find specific information within the annual report.-
 1
1 -
 2
2 -
 3
3 -
 4
4 -
 5
5 -
 6
6 -
 7
7 -
 8
8 -
 9
9 -
 10
10 -
 11
11 -
 12
12 -
 13
13 -
 14
14 -
 15
15 -
 16
16 -
17
-
18
-
19
-
20
-
21
-
22
-
23
-
24
-
25
-
26
-
27
-
28
-
29
-
30
-
31
-
32
-
33
-
34
-
35
-
36
-
37
-
38
-
39
-
40
-
41
-
42
-
43
-
44
-
45
-
46
-
47
-
48
-
49
-
50
-
51
-
52
-
53
-
54
-
55
-
56
-
57
-
58
-
59
-
60
-
61
-
62
-
63
-
64
-
65
-
66
-
67
-
68
-
69
-
70
-
71
-
72
-
73
-
74
-
75
-
76
-
77
-
78
-
79
-
80
-
81
-
82
-
83
-
84
-
85
-
86
-
87
-
88
-
89
-
90
-
91
-
92
-
93
-
94
-
95
-
96
-
97
-
98
-
99
-
100
-
101
-
102
-
103
-
104
-
105
-
106
-
107
-
108
-
109
-
110
-
111
-
112
-
113
-
114
-
115
-
116
 |
 |

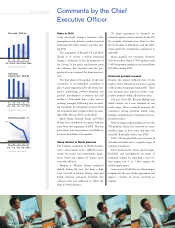
Assets (SEK bn)
88.0 107.4 115.7 118.1 120.1
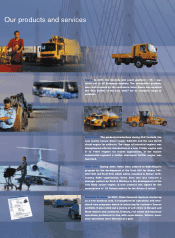
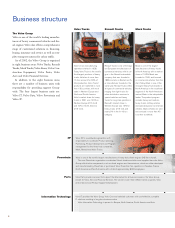
Global Trucks
Global Trucks includes the
truck operations of the Volvo
Group, consisting of the truck
brands Mack, Renault and
Volvo.
10.6 14.3 14.7 17.2 16.7
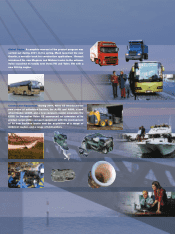
Buses
A year characterized by inten-
se product renewal built on the
TX-platform and by difficult
market conditions.
16.7 19.4 18.9 20.0 21.1
Construction Equipment
Successful introductions of the
new generation of products.
Sales all time high but, mar-
kets slowing down at the end
of the year.
4.5 4.9 5.8 6.6 7.4
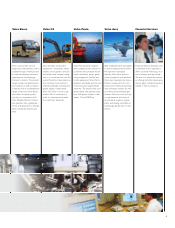
Volvo Penta
Best year ever, based on a solid
product portfolio and in-
creasing market shares.
7.5 8.6 10.0 10.7 11.8
Volvo Aero
Record high sales and earnings
in 2001. Focus on managing
the sharp downturn in air traffic
since September 11, 2001.
33.3 43.2 56.5 66.5 73.5
Financial Services
Financial services launched for
Renault and Mack in 2001. Con-
tinued asset growth but lower
earnings in 2001 due to the down-
turn on the US truck market.
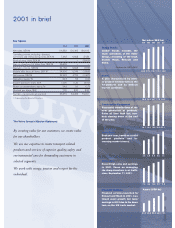
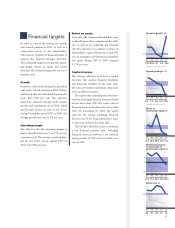
Key figures
1999 2000 2001
Net sales, SEK M 116,382 120,392 180,615
Operating income, excluding divested
operations and restructuring costs, SEK M 7,463 6,668 3,186
Restructuring costs, SEK M – – (3,862)
Gain on divestment of Volvo Cars, SEK M 26,695 – –
Operating income, SEK M 34,158 6,668 (676)
Income after financial items, SEK M 34,596 6,246 (1,866)
Net income, SEK M 32,222 4,709 (1,467)
Operating margin, % 29.3 5.5 (0.4)
Income (loss) per share, SEK 73.00 11.20 (3.50)
Return on shareholders’ equity, % 34.9 5.0 (1.7)
Dividend per share, SEK 7.00 8.00 8.00 1
Number of employees at year-end 53,470 54,266 70,921
1 Proposed by the Board of Directors.
The Volvo Group’s Mission Statement
By creating value for our customers, we create value
for our shareholders.
We use our expertise to create transport-related
products and services of superior quality, safety and
environmental care for demanding customers in
selected segments.
We work with energy, passion and respect for the
individual.
2001 in brief
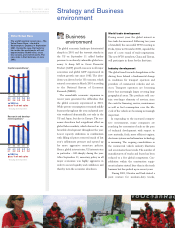
Net sales (SEK bn)
97 98 99 00 01
Proforma for 1997–2000