Volvo 2001 Annual Report Download - page 103
Download and view the complete annual report
Please find page 103 of the 2001 Volvo annual report below. You can navigate through the pages in the report by either clicking on the pages listed below, or by using the keyword search tool below to find specific information within the annual report.-
 1
1 -
2
-
3
-
4
-
5
-
6
-
7
-
8
-
9
-
10
-
11
-
12
-
13
-
14
-
15
-
16
-
17
-
18
-
19
-
20
-
21
-
22
-
23
-
24
-
25
-
26
-
27
-
28
-
29
-
30
-
31
-
32
-
33
-
34
-
35
-
36
-
37
-
38
-
39
-
40
-
41
-
42
-
43
-
44
-
45
-
46
-
47
-
48
-
49
-
50
-
51
-
52
-
53
-
54
-
55
-
56
-
57
-
58
-
59
-
60
-
61
-
62
-
63
-
64
-
65
-
66
-
67
-
68
-
69
-
70
-
71
-
72
-
73
-
74
-
75
-
76
-
77
-
78
-
79
-
80
-
81
-
82
-
83
-
84
-
85
-
86
-
87
-
88
-
89
-
90
-
91
-
92
-
 93
93 -
 94
94 -
 95
95 -
 96
96 -
 97
97 -
 98
98 -
 99
99 -
 100
100 -
 101
101 -
 102
102 -
 103
103 -
 104
104 -
 105
105 -
 106
106 -
 107
107 -
 108
108 -
 109
109 -
 110
110 -
 111
111 -
 112
112 -
 113
113 -
114
-
115
-
116
 |
 |
99
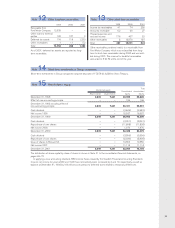
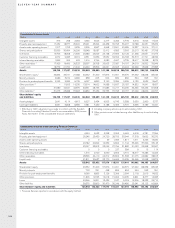
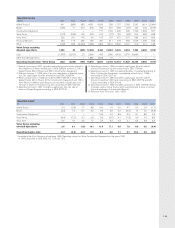
Consolidated income statements
SEKM 1991 1992 1993 1994 1995 1996 1997 1998 1999 2000 2001
Net sales 77,223 83,002 111,155 155,866 171,511 156,060 183,625 212,936 125,019 130,070 189,280
Cost of sales (66,143) (85,840) (115,092) (128,529) (121,249) (138,990) (163,876) (99,501) (104,548) (155,592)
Gross income 16,859 25,315 40,774 42,982 34,811 44,635 49,060 25,518 25,522 33,688
Research and development expenses (6,243) (4,438) (4,652) (7,343) (8,271) (8,659) (10,104) (4,525) (4,876) (5,391)
Selling expenses (8,717) (11,480) (15,737) (17,418) (14,895) (17,160) (19,042) (8,865) (10,140) (15,766)
Administrative expenses (4,151) (6,131) (7,711) (7,399) (6,685) (7,018) (8,091) (4,791) (4,974) (6,709)
Other operating income and expenses 517 (1,146) (3,262) (1,657) (1,087) (3,141) (2,634) (611) 622 (4,096)
Income from investments in
associated companies 120 (1,749) 5,861 2,119 314 2,929 444 567 444 50
Income from other shares and participations 157 444 1,667 788 9,007 1,168 4,526 170 70 1,410
Income from divestment of subsidiaries ––––3,032 – – – 26,695 – –
Restructuring costs 1–(1,450) (1,600) – (1,817) – – (2,331) – – (3,862)
Operating income (loss) (542) (2,908) (785) 16,940 13,287 13,194 12,754 11,828 34,158 6,668 (676)
Interest income and similar credits 3,694 4,041 2,927 3,801 4,530 3,197 1,268 1,812 1,588 1,275
Interest expenses and similar charges (4,906) (5,458) (3,572) (3,686) (3,114) (2,699) (1,315) (1,505) (1,845) (2,274)
Other financial income and expenses (629) (440) 83 (354) (407) (76) (162) 131 (165) (191)
Income (loss) after
financial items 803 (4,749) (2,642) 16,378 13,048 14,203 13,176 11,619 34,596 6,246 (1,866)
Taxes (560) 138 (468) (2,783) (3,741) (1,825) (2,583) (3,140) (2,270) (1,510) 326
Minority interests in net income 439 1,291 (356) (365) (45) 99 (112) (42) (104) (27) 73
Net income (loss) 682 (3,320) (3,466) 13,230 9,262 12,477 10,481 8,437 32,222 4,709 (1,467)
1 In 1995 write-down of goodwill pertaining to Volvo Construction Equipment.
Consolidated income statements with Financial Services reported in accordance with the equity method
SEKM 1991 1992 1993 1994 1995 1996 1997 1998 1999 2000 2001
Net sales 76,110 81,858 109,978 154,668 166,541 150,425 178,531 205,712 116,382 120,392 180,615
Cost of sales (135,027) (158,077) (92,772) (97,131) (149,477)
Gross income 43,504 47,635 23,610 23,261 31,138
Research and development expenses (8,659) (10,104) (4,525) (4,876) (5,391)
Selling expenses (16,763) (18,468) (8,117) (9,285) (14,663)
Administrative expenses (6,889) (7,950) (4,632) (4,651) (6,474)
Other operating income and expenses (3,015) (2,515) (587) 309 (3,071)
Income from Financial Services 375 681 1,066 1,499 325
Income from investments in
associated companies 3,033 354 478 341 (86)
Income from other shares and
participations 1,168 4,526 170 70 1,408
Income from divestment of subsidiaries – – 26,695 – –
Restructuring costs –(2,331) – – (3,862)
Operating income (loss) (542) (2,908) (785) 16,940 13,287 13,194 12,754 11,828 34,158 6,668 (676)
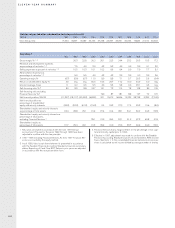
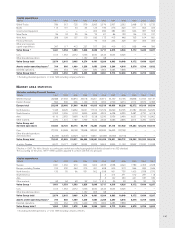
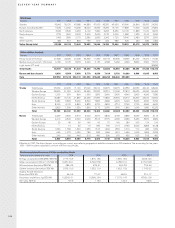
Eleven-year summary