Volvo 2001 Annual Report Download - page 81
Download and view the complete annual report
Please find page 81 of the 2001 Volvo annual report below. You can navigate through the pages in the report by either clicking on the pages listed below, or by using the keyword search tool below to find specific information within the annual report.-
 1
1 -
2
-
3
-
4
-
5
-
6
-
7
-
8
-
9
-
10
-
11
-
12
-
13
-
14
-
15
-
16
-
17
-
18
-
19
-
20
-
21
-
22
-
23
-
24
-
25
-
26
-
27
-
28
-
29
-
30
-
31
-
32
-
33
-
34
-
35
-
36
-
37
-
38
-
39
-
40
-
41
-
42
-
43
-
44
-
45
-
46
-
47
-
48
-
49
-
50
-
51
-
52
-
53
-
54
-
55
-
56
-
57
-
58
-
59
-
60
-
61
-
62
-
63
-
64
-
65
-
66
-
67
-
68
-
69
-
70
-
 71
71 -
 72
72 -
 73
73 -
 74
74 -
 75
75 -
 76
76 -
 77
77 -
 78
78 -
 79
79 -
 80
80 -
 81
81 -
 82
82 -
 83
83 -
 84
84 -
 85
85 -
 86
86 -
 87
87 -
 88
88 -
 89
89 -
 90
90 -
 91
91 -
92
-
93
-
94
-
95
-
96
-
97
-
98
-
99
-
100
-
101
-
102
-
103
-
104
-
105
-
106
-
107
-
108
-
109
-
110
-
111
-
112
-
113
-
114
-
115
-
116
 |
 |
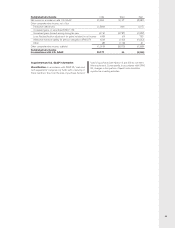
77
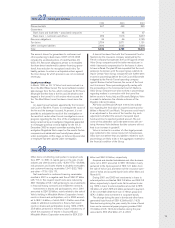
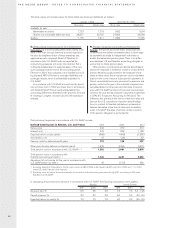
Other Fair
Currencies Currencies value 2
Inflow Inflow Inflow
SEKM USD GBP EUR Net SEK SEK
Due date 2002 amount 482 175 418 32 10,840
rate19.05 14.46 9.30
Due date 2003 amount 132 (4) 0 (374) 846
rate19.24 15.06 0.00
Due date 2004 amount 74 (6) 0 (232) 466
rate110.34 15 0.00
Total 688 165 418 (574) 12,152
of which, option contracts 19 0 0 (75) 0
Fair value of flows in
forward contracts 2(7,140) (2,523) (3,876) 462 11,877 (1,200)
1Average forward contract rate.
2 Outstanding forward contracts valued to market rates.
3Average exchange rate during the financial year.
4Outstanding currency contracts, regarding commercial exposure due in 2002, percentage of net flow 2001.
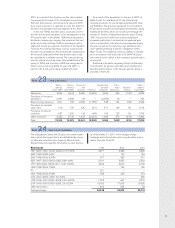
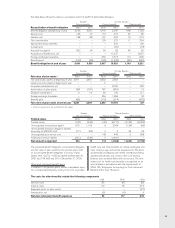
Volvo Group’s outstanding currency derivative contracts pertaining to commercial exposure,
December 31, 2001
The table shows forward exchange contracts and option contracts to hedge future flows of commercial payments.
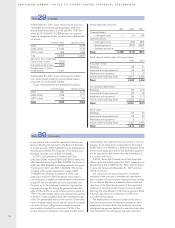
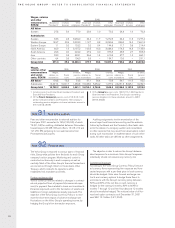
Financial exposure
Group companies operate in local currencies. Through
loans and investments being mainly in the local currency,
financial exposure is reduced. In companies which have
loans and investments in foreign currencies, hedging is
carried out in accordance with Volvo’s financial policy,
which means no currency risks is assumed.
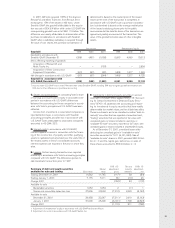
Equity exposure
In conjunction with translation of the Group’s assets and
liabilities in foreign subsidiaries to Swedish kronor a risk
arises that the currency rate will have an effect on the
consolidated balance sheet. Companies in the Volvo
Group are generally formed or acquired with a long term
perspective, where equity is used to fund real assets that
are not to be realized within a foreseeable future. Further-
more, foreign equity exposure is relatively limited in relation
to the consolidated equity in the Volvo Group balance sheet.
As a consequence of the above, equity hedging will
primarily be used if a foreign Volvo Group company is
over capitalized. To avoid extensive equity exposure, the
level of equity in Volvo Group companies will be kept at a
commercially, legally and fiscally optimal level. At year-
end 2001, net assets in subsidiaries and associated
companies outside Sweden amounted SEK 28.1 billion.
Hedging of translation exposure from shareholdings
in foreign associated companies or minority interest
companies will be executed on a case-by-case basis.
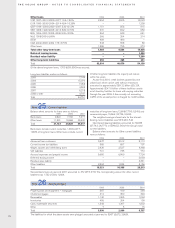
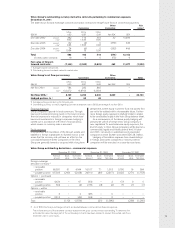
Volvo Group outstanding derivatives – commercial exposure
December 31, 1999 December 31, 2000 December 31, 2001
Notional Book Estimated Notional Book Estimated Notional Book Estimated
amount value fair value amount value fair value amount value fair value
Foreign exchange
derivative contracts 5
– receivable
position 69,531 91 4,044 19,017 71 1,513 9,780 16 554
– payable position 107,509 (203) (5,628) 24,910 (89) (2,817) 20,022 (271) (1,753)
Options – purchased
– receivable
position 4,434 – 67 808 – 2 173 0 0
– payable position 392 – (4) 1,736 (3) (4) 75 (1) (1)
Options – written
– receivable
position 3 – 0 385 – 0 – – –
– payable position 3,415 – (49) 568 – 0 – – –
Total (112) (1,570) (21) (1,306) (256) (1,200)
5As of 2000, the foreign exchange contracts are divided between commercial and financial exposure.
The notional amount of the derivative contracts represents the gross contract amount outstanding. To determine the
estimated fair value, the major part of the outstanding contracts have been marked to market. Discounted cash flows
have been used in some cases.
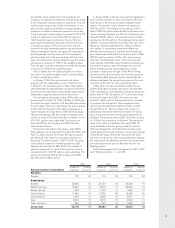
Volvo Group’s net flow per currency Other
Currencies Currencies Total
Inflow Inflow Inflow
SEKM USD GBP EUR Net SEK SEK
Net flow 2001 amount 784 282 865 –
rate 310.3272 14.8763 9.2434 –
Net flow SEK, 38,100 4,200 8,000 3,800 – 24,100
Hedged portion, % 461 62 48