Volvo 2001 Annual Report Download - page 42
Download and view the complete annual report
Please find page 42 of the 2001 Volvo annual report below. You can navigate through the pages in the report by either clicking on the pages listed below, or by using the keyword search tool below to find specific information within the annual report.-
 1
1 -
2
-
3
-
4
-
5
-
6
-
7
-
8
-
9
-
10
-
11
-
12
-
13
-
14
-
15
-
16
-
17
-
18
-
19
-
20
-
21
-
22
-
23
-
24
-
25
-
26
-
27
-
28
-
29
-
30
-
31
-
 32
32 -
 33
33 -
 34
34 -
 35
35 -
 36
36 -
 37
37 -
 38
38 -
 39
39 -
 40
40 -
 41
41 -
 42
42 -
 43
43 -
 44
44 -
 45
45 -
 46
46 -
 47
47 -
 48
48 -
 49
49 -
 50
50 -
 51
51 -
 52
52 -
53
-
54
-
55
-
56
-
57
-
58
-
59
-
60
-
61
-
62
-
63
-
64
-
65
-
66
-
67
-
68
-
69
-
70
-
71
-
72
-
73
-
74
-
75
-
76
-
77
-
78
-
79
-
80
-
81
-
82
-
83
-
84
-
85
-
86
-
87
-
88
-
89
-
90
-
91
-
92
-
93
-
94
-
95
-
96
-
97
-
98
-
99
-
100
-
101
-
102
-
103
-
104
-
105
-
106
-
107
-
108
-
109
-
110
-
111
-
112
-
113
-
114
-
115
-
116
 |
 |
38
BUSINESS AREAS
low capacity utilization in the production
facilities in the same markets. Important
investments in the product development
and launch of the TX-platform also repre-
sented a significant cost during 2001. A
notably positive development in cash flow
was attained through tight capital control of
inventories and receivables.
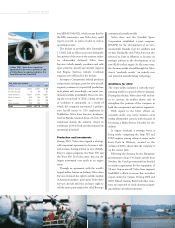
Production and investments
During the year Volvo produced 10,167
(11,244) buses and bus chassis, of which
43% were complete buses. The degree of uti-
lization in the production system in Europe
and North America was affected by the
downturn in the market. Volvo has gradual-
ly throughout 2001 taken measures to adapt
the cost structure to the prevailing order
situation. Major reductions in the workforce
were made successively both in Europe and
in North America. The Nova Bus operations
in Roswell, US, was announced to be either
divested or closed down during 2002 and, as
a consequence, a restructuring charge of SEK
392 M, was recorded.
The introduction of the TX-platform pro-
vides Volvo with one of the most modern
product ranges in the bus industry including
complete buses and chassis for city and
intercity traffic as well as coaches, which
meets customers and environmental
demands as well as internal requirements for
production efficiency.
Volvo has also started up production of
luxury coaches in the Volvo factory in India
during 2001.
Ambitions for 2002
To meet the developments in the industry
and the market the process of exploiting
existing strengths and building for the future
continues. A quick turnaround focusing on
the key areas in this process as capitalize on
the excellent product range, reduced prod-
uct costs based on more efficient production
processes, strengthened structure and
improved assets management.
Neoplan and formed Neoman. In North
America, Thomas Built, Orion and Setra
were reorganized into the DaimlerChrysler
Commercial Group.
Market development
The deliveries of buses from Volvo amount-
ed to 9,953 (11,015) units during 2001, 10%
less than in 2000. The decline was attribut-
able mainly to lower volumes in the Nordic
area, UK, the US and Canada. This was com-
pensated in part by a strong development in
China and Mexico.
The tough market conditions in Europe,
the US and Canada resulted in increased
price competition, which affected Volvo’s
market share negatively. Volvo’s intention to
stay out of unprofitable deals resulted in a
negative effect on the market share develop-
ment in continental Europe, the US and
Brazil. Asia, and in particular China, showed
strong development.
At the end of December, order bookings
were at the same level as a year earlier. A
major positive development was posted in
the Nordic region during the fourth quarter
of 2001 with sizeable orders to some major
customers, which means that the utilization
in the European industrial system will be
significantly improved.
Financial performance
Net sales in 2001 declined to SEK 16,675 M
(17,187). Volvo changed ownership in the
joint venture in North America from 51% to
50%. As a consequence, Prévost and Nova
are consolidated using the proportionate
method as of October 1, 2001, which has
affected the sales value and the operating
income. The effect was limited.
The operating loss, excluding restructur-
ing costs was SEK 524 M compared with an
operating income of SEK 440 M in 2000.
The main reasons for the loss are the lower
deliveries in Europe and North America and,
as a consequence of the reduced volume, a
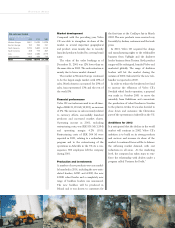
Number of vehicles invoiced Buses
1999 2000 2001
Western Europe 3,430 3,870 2,899
Eastern Europe 200 124 216
North America 3,640 3,869 3,128
South America 710 980 1,009
Asia 1,000 1,659 2,209
Other markets 520 513 492
Total 9,500 11,015 9,953
Largest markets Buses
Registered Market share,
buses %
2000 2001 2000 2001
Mexico 1,620 1,660 16.0 16.1
USA11,520 1,110 n/a n/a
China with
Hong Kong1450 930 n/a n/a
Great Britain 1,230 890 48.6 38.7
Iran 560 600 n/a n/a
1 Deliveries from factory.
Net sales per market Buses
SEK M 1999 2000 2001
Western Europe 5,735 6,767 6,263
Eastern Europe 226 182 373
North America 6,871 7,723 6,847
South America 469 732 757
Asia 943 1,269 1,839
Other markets 469 514 596
Total 14,713 17,187 16,675