Volvo 2001 Annual Report Download - page 83
Download and view the complete annual report
Please find page 83 of the 2001 Volvo annual report below. You can navigate through the pages in the report by either clicking on the pages listed below, or by using the keyword search tool below to find specific information within the annual report.-
 1
1 -
2
-
3
-
4
-
5
-
6
-
7
-
8
-
9
-
10
-
11
-
12
-
13
-
14
-
15
-
16
-
17
-
18
-
19
-
20
-
21
-
22
-
23
-
24
-
25
-
26
-
27
-
28
-
29
-
30
-
31
-
32
-
33
-
34
-
35
-
36
-
37
-
38
-
39
-
40
-
41
-
42
-
43
-
44
-
45
-
46
-
47
-
48
-
49
-
50
-
51
-
52
-
53
-
54
-
55
-
56
-
57
-
58
-
59
-
60
-
61
-
62
-
63
-
64
-
65
-
66
-
67
-
68
-
69
-
70
-
71
-
72
-
 73
73 -
 74
74 -
 75
75 -
 76
76 -
 77
77 -
 78
78 -
 79
79 -
 80
80 -
 81
81 -
 82
82 -
 83
83 -
 84
84 -
 85
85 -
 86
86 -
 87
87 -
 88
88 -
 89
89 -
 90
90 -
 91
91 -
 92
92 -
 93
93 -
94
-
95
-
96
-
97
-
98
-
99
-
100
-
101
-
102
-
103
-
104
-
105
-
106
-
107
-
108
-
109
-
110
-
111
-
112
-
113
-
114
-
115
-
116
 |
 |

79
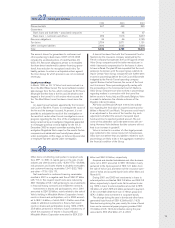
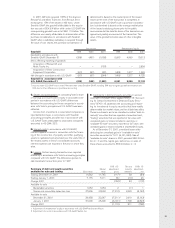
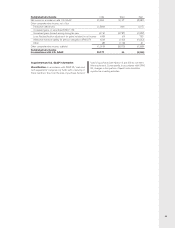
A summary of the Volvo Group’s net income and share-
holders’ equity determined in accordance with U.S.
GAAP, is presented in the accompanying tables.
Application of U.S. GAAP would have the following
effect on consolidated net income and shareholders’
equity:
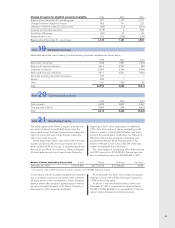
Net income 1999 2000 2001
Net income in accordance with Swedish accounting principles 32,222 4,709 (1,467)
Items increasing (decreasing) reported net income
Derivative instruments and hedging activities (A) 576 (654) 172
Business combinations (B) (91) (91) (744)
Shares and participations (C) 12 24 –
Interest costs (D) 21 (3) 18
Leasing (E) 39 16 13
Investments in debt and equity securities (F) 253 (548) (153)
Restructuring costs and income from divestment of Volvo Cars (G) (1,325) (281) (579)
Pensions and other post-employment benefits (H) 40 (170) 456
Alecta surplus funds (I) – (523) 111
Software development (J) 370 384 (212)
Product development (K) – – (1,962)
Entrance fees, aircraft engine programs (L) (22) (336) (324)
Tax effect of above U.S. GAAP adjustments (405) 600 690
Net increase (decrease) in net income (532) (1,582) (2,514)
Net income in accordance with U.S. GAAP 31,690 3,127 (3,981)
Net income per share, SEK in
accordance with U.S. GAAP 71.80 7.40 (9.40)
Weighted average number of shares outstanding (in thousands) 441,521 421,684 422,429
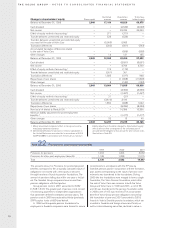
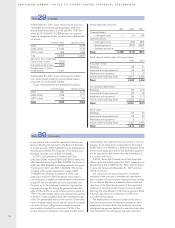
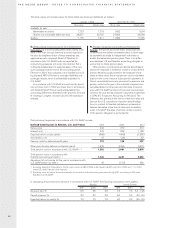
Estimated fair value of Volvo’s financial instruments
December 31, 1999 December 31, 2000 December 31, 2001
Book Fair Book Fair Book Fair
value value value value value value
Balance sheet items
Investments in shares and participations
fair value determinable 13,537 2,212 27,589 20,955 25,245 17,661
fair value not determinable 2241 – 372 – 586 –
Long-term receivables and loans 36,240 36,751 28,646 29,095 32,432 32,860
Short-term receivables and loans 17,508 17,288 33,078 35,338 24,822 24,765
Marketable securities 20,956 21,534 9,568 9,603 13,514 13,399
Long-term loans and debts 32,514 32,394 40,670 41,792 54,130 56,903
Short-term loans 21,123 20,429 25,828 27,000 36,817 35,898
Off-balance-sheet items
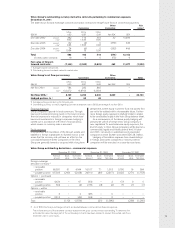
Volvo Group outstanding derivative contracts
– commercial exposure (112) (1,570) (21) (1,306) (256) (1,200)
Volvo Group outstanding derivative contracts
– financial exposure 113 (368) 125 (1,873) (556) (425)
1Pertains mainly to Volvo’s holdings in Mitsubishi Motors
Corporation 1999 as well as 2000, and in Scania AB 2000
as well as 2001.
2No single investment represents any significant amount.
Note 33 Net income and shareholders’ equity in accordance with U.S. GAAP
Volvo does not have any significant exposure to an
individual customer or counterparty.
Calculation of fair value of financial instruments
Volvo has used generally accepted methods to calculate
the market value of the Group’s financial instruments as
of December 31, 1999, 2000 and 2001. In the case of
instruments with maturities shorter than three months –
such as liquid funds and certain current liabilities as well
as certain short-term loans – the book value has been
assumed to closely approximate market value.
Official exchange rates and prices quoted in the open
market have been used initially for purposes of valuation.
In their absence, the valuation has been made by dis-
counting future cash flows at the market interest rate for
each maturity. These values are estimates and will not
necessarily be realized.