Volvo 2000 Annual Report Download - page 86
Download and view the complete annual report
Please find page 86 of the 2000 Volvo annual report below. You can navigate through the pages in the report by either clicking on the pages listed below, or by using the keyword search tool below to find specific information within the annual report.-
 1
1 -
2
-
3
-
4
-
5
-
6
-
7
-
8
-
9
-
10
-
11
-
12
-
13
-
14
-
15
-
16
-
17
-
18
-
19
-
20
-
21
-
22
-
23
-
24
-
25
-
26
-
27
-
28
-
29
-
30
-
31
-
32
-
33
-
34
-
35
-
36
-
37
-
38
-
39
-
40
-
41
-
42
-
43
-
44
-
45
-
46
-
47
-
48
-
49
-
50
-
51
-
52
-
53
-
54
-
55
-
56
-
57
-
58
-
59
-
60
-
61
-
62
-
63
-
64
-
65
-
66
-
67
-
68
-
69
-
70
-
71
-
72
-
73
-
74
-
75
-
 76
76 -
 77
77 -
 78
78 -
 79
79 -
 80
80 -
 81
81 -
 82
82 -
 83
83 -
 84
84 -
 85
85 -
 86
86 -
 87
87 -
 88
88 -
 89
89 -
 90
90 -
 91
91 -
 92
92 -
 93
93 -
 94
94 -
 95
95 -
 96
96 -
97
-
98
-
99
-
100
-
101
-
102
-
103
-
104
-
105
-
106
-
107
-
108
-
109
-
110
-
111
-
112
 |
 |
PARENT COMPANY AB VOLVO
NOTES TO FINANCIAL STATEMENTS
84
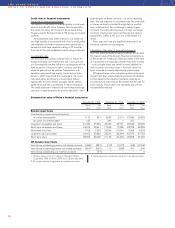
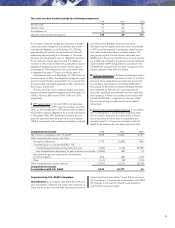
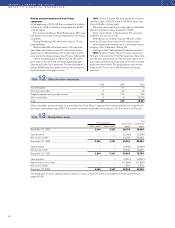
Exchange differences on borrowings and lendings, in-
cluding forward contracts related to loans, amounted to
3 (60; –306). Since these loans are largely designed to
hedge net assets in foreign currencies, most of the
translation differences do not affect consolidated
income. In 1998, unrealized exchange gains on long-
term receivables and liabilities in foreign currencies were
allocated to an exchange reserve. Exchange differences
related to operations are included in Other operating
income and expenses. Other financial income and
expenses also include guarantee commissions from sub-
sidiaries, unrealized losses pertaining to a hedge for a
program of personnel options and costs for confirmed
credit facilities as well as costs of having Volvo shares
registered on various stock exchanges.
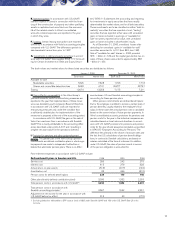
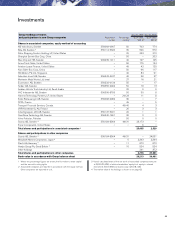
Value in Value in Value in
balance sheet balance sheet Sales/ balance sheet
Acquisition cost 1998 1999 Investments scrapping 2000
Rights 52 52 – – 52
Total intangible assets 52 52 – – 52
Buildings 17 7 5 0 12
Land and land improvements 6 4 1 – 5
Machinery and equipment 54 53 4 (8) 49
Total tangible assets 77 64 10 (8) 66
Value in Value in Value in Book value
balance sheet balance sheet Sales/ balance sheet in balance
Accumulated depreciation 1998 21999 2Depreciation1scrapping 2000 2sheet 20003
Rights 13 26 13 – 39 13
Total intangible assets 13 26 13 – 39 13
Buildings 0 1 0 0 1 11
Land and land improvements 0 0 0 – 0 5
Machinery and equipment 37 39 4 (8) 35 14
Total tangible assets 37 40 4 (8) 36 30
The assessed value of buildings was 4 (2; 5) and of land
2 (2; 2). Investments in intangible and tangible assets
amounted to – (–; 52) and 10 (2; 20) respectively.
Capital expenditures approved but not yet implemented
at year-end 2000 amounted to 1 (1; 1).
1. Including write-downs
2. Including accumulated write-downs
3. Acquisition value, less depreciation
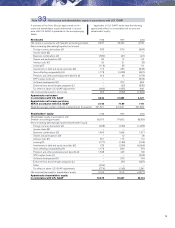
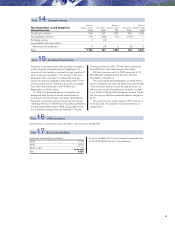
1998 1999 2000
Provision to tax allocation reserve (978) (297) (250)
Reversal of tax equalization reserve 89 62 114
Reversal of exchange reserve 199 4 –
Allocation to extra depreciation 4 4 3
Total (686) (227) (133)
Taxes, –117 (384; –816) pertain to governmental income
taxes –217 (–165; –816) as well as to reversed provi-
sions of 100 (549; –) pertaining to governmental income
taxes for preceding years.
Provision has been made for estimated tax expenses
that may arise as a consequence of the tax audit carried
out mainly during 1992. Claims for which provisions are
not deemed necessary amount to 297 (288; 341), which
is included in contingent liabilities.
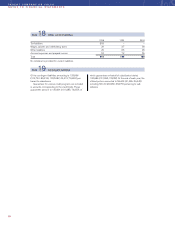
Note 7Other financial income and expenses
Note 8 Allocations
Note 9 Taxes
Note 10 Intangible and tangible assets
Interest income and similar credits amounting to 266 (564; 341) included interest in the amount of 141 (469; 325)
from subsidiaries and interest expenses and similar charges totaling 353 (570; 760), included interest totaling 340
(543; 742) paid to subsidiaries.
Note 6 Interest income (expenses)