Volvo 2000 Annual Report Download - page 23
Download and view the complete annual report
Please find page 23 of the 2000 Volvo annual report below. You can navigate through the pages in the report by either clicking on the pages listed below, or by using the keyword search tool below to find specific information within the annual report.-
 1
1 -
2
-
3
-
4
-
5
-
6
-
7
-
8
-
9
-
10
-
11
-
12
-
 13
13 -
 14
14 -
 15
15 -
 16
16 -
 17
17 -
 18
18 -
 19
19 -
 20
20 -
 21
21 -
 22
22 -
 23
23 -
 24
24 -
 25
25 -
 26
26 -
 27
27 -
 28
28 -
 29
29 -
 30
30 -
 31
31 -
 32
32 -
 33
33 -
34
-
35
-
36
-
37
-
38
-
39
-
40
-
41
-
42
-
43
-
44
-
45
-
46
-
47
-
48
-
49
-
50
-
51
-
52
-
53
-
54
-
55
-
56
-
57
-
58
-
59
-
60
-
61
-
62
-
63
-
64
-
65
-
66
-
67
-
68
-
69
-
70
-
71
-
72
-
73
-
74
-
75
-
76
-
77
-
78
-
79
-
80
-
81
-
82
-
83
-
84
-
85
-
86
-
87
-
88
-
89
-
90
-
91
-
92
-
93
-
94
-
95
-
96
-
97
-
98
-
99
-
100
-
101
-
102
-
103
-
104
-
105
-
106
-
107
-
108
-
109
-
110
-
111
-
112
 |
 |
21
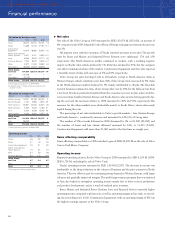
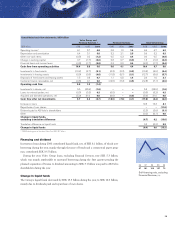
Operating net flow per currency,
excluding divested operations
SEK M 1998 1999 2000
USD 6,400 6,400 7,000
EUR 6,900 7,900 7,500
GBP 2,700 4,200 4,000
JPY (100) 0 (300)
Other currencies 2,200 3,800 1,100
Total 18,100 22,300 19,300
Operating income for 2000 includes SEK 610 M pertaining to realized gains on the remain-
ing securities portfolio in Volvia. Operating income also includes surplus funds of SEK 683 M
from SPP. Income also includes SEK 520 M resulting from a favorable adjustment of gain on
the sale of Volvo Cars. The adjustment of income was due to a supplement to the purchase
price and to the fact that part of a reserve for restructuring costs proved to be unnecessary.
Operating income in the second quarter was charged with provisions within Volvo Trucks in
the amount of approximately SEK 160 M. Operating income in 1999 included a capital gain
of SEK 180 M in connection with the sale of a company in Construction Equipment, as well
as the reversals of reserves of approximately SEK 240 M for customer-financing operations.
The Volvo Group’s operating margin for the year amounted to 4.7% (5.4).
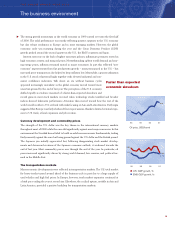
Impact of exchange rates on operating income
The effect of changes in currency exchange rates on operating income in 2000 compared with
1999 was approximately SEK 50 M.
The Swedish krona weakened during 2000 against the inflow currencies, the U.S. dollar,
Canadian dollar and British pound, with considerably positive effects on operating income.
The Swedish krona strengthened against the major inflow currency Euro with adverse effect
on operating income as a consequence. The negative effect was intensified by the weakened
krona against the South-Korean won, in which the Volvo Group has an outflow equivalent to
about SEK 2 billion. Changes in spot-market rates for other currencies had minor effects. The
total effect of changed spot-market rates was positive, approximately SEK 220 M.
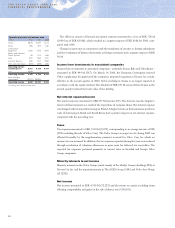
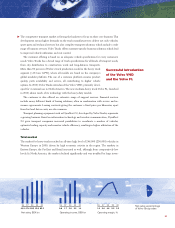
Change of operating income
SEK M
Operating income excluding
items affecting comparability 1999 6,726
Decreased volumes (2,190)
Change in product and market mix, etc. +910
Higher research and development expenses (350)
Reversal of reserves in customer-
financing operations, 1999 (240)
Capital gain on the sale of a company in
Construction Equipment, 1999 (180)
Adjustment of the gain on sale of Volvo Cars +520
Surplus funds from SPP +683
Gains on sale of securities portfolio in Volvia +610
Other (335)
Operating income 2000 6,154
Consolidated income statements Excluding
Cars
SEK M 1998 1998 1999 2000
Net sales 212,936 114,854 125,019 130,070
Cost of sales (163,876) (89,305) (99,501) (104,548)
Gross income 49,060 25,549 25,518 25,522
Research and development expenses (10,104) (4,265) (4,525) (4,876)
Selling expenses (19,042) (8,929) (8,865) (10,140)
Administrative expenses (8,091) (5,652) (4,791) (4,974)
Other operating income and expenses (2,634) (1,322) (611) 622
Items affecting comparability 1(2,331) (1,650) 26,695 –
Operating income 6,858 3,731 33,421 6,154
Income from investments in associated companies 444 567 444
Income from other investments 4,526 170 70
Interest income and similar credits 1,268 1,812 1,588
Interest expenses and similar charges (1,315) (1,505) (1,845)
Other financial income and expenses (162) 131 (165)
Income after financial items 11,619 34,596 6,246
Taxes (3,140) (2,270) (1,510)
Minority interests (42) (104) (27)
Net income 8,437 32,222 4,709
Income per share 19.10 73.00 11.20
1 Items affecting comparability in 1999 pertain to the sale of Volvo Cars and in 1998 to provisions for restructuring costs.
Impact of exchange rates
on operating income
Compared with preceding year, SEK M
Net sales +2,850
Cost of sales (2,370)
Research and development expenses (50)
Selling and administrative expenses (620)
Other operating income and expenses +240
Total effect of changes in exchange
rates on operating income +50
Group sales are reported at average spot prices and the
effects of currency hedges are reported among “Other oper-
ating income and expenses.”