Volvo 2000 Annual Report Download - page 13
Download and view the complete annual report
Please find page 13 of the 2000 Volvo annual report below. You can navigate through the pages in the report by either clicking on the pages listed below, or by using the keyword search tool below to find specific information within the annual report.-
 1
1 -
2
-
 3
3 -
 4
4 -
 5
5 -
 6
6 -
 7
7 -
 8
8 -
 9
9 -
 10
10 -
 11
11 -
 12
12 -
 13
13 -
 14
14 -
 15
15 -
 16
16 -
 17
17 -
 18
18 -
 19
19 -
 20
20 -
 21
21 -
 22
22 -
 23
23 -
24
-
25
-
26
-
27
-
28
-
29
-
30
-
31
-
32
-
33
-
34
-
35
-
36
-
37
-
38
-
39
-
40
-
41
-
42
-
43
-
44
-
45
-
46
-
47
-
48
-
49
-
50
-
51
-
52
-
53
-
54
-
55
-
56
-
57
-
58
-
59
-
60
-
61
-
62
-
63
-
64
-
65
-
66
-
67
-
68
-
69
-
70
-
71
-
72
-
73
-
74
-
75
-
76
-
77
-
78
-
79
-
80
-
81
-
82
-
83
-
84
-
85
-
86
-
87
-
88
-
89
-
90
-
91
-
92
-
93
-
94
-
95
-
96
-
97
-
98
-
99
-
100
-
101
-
102
-
103
-
104
-
105
-
106
-
107
-
108
-
109
-
110
-
111
-
112
 |
 |

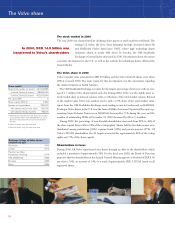
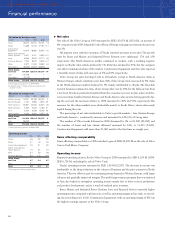
Financial goals
Growth
In order to achieve the strategy for growth as well as the wanted position in 2005, Volvo’s
ambition is that net sales should increase by more than 10 percent per year. The objective
should be reached both through organic growth and through acquisitions. During the period
1996 to 2000 the average growth rate was 11.4 percent per year.
Operating margin
The objective for the operating margin is that it should be between 5 and 7 percent over an
economic cycle. The average operating margin for the Volvo Group during 1996 to 2000 was
4.4 percent per year.
Return on equity
Over time, the after-tax return on shareholders’ equity should more than compensate for infla-
tion as well as for industrial and financial risk. The objective is to achieve an after-tax return
on shareholders’ equity of between 12 and 15 percent over an economic cycle. Return on
shareholders’ equity during 1996 to 2000 averaged 18.8 percent per year.
Capital structure
The Group’s objective is to have a capital structure that enables financial flexibility and long-
term stability. At the same time, the aim is to conduct operations using capital in an efficient
manner.
The equity ratio, including minority interests but excluding Financial Services, should not
be lower than 40 percent. The equity ratio in Financial Services should not be lower than 10
percent.
The Group’s objective is also to maintain a net financial assets/net debt ratio, excluding
Financial Services, between a net financial assets position of 15 percent and a net debt posi-
tion of 30 percent.
The average net financial asset ratio was 22.4 percent during 1996–2000.
96 97 98 99 00
Net sales growth*, %
(1.8) 21.5 24.6 8.9 4.0
10
96 97 98 99 00
Return on shareholders
equity, %
23.7 17.2 13.0 34.9 5.0
12
15
96 97 98 99 00
Net financial assets**
as percentage of
shareholders’ equity, %
20.6 30.4 21.1 29.3 10.6
15
–30
0
96 97 98 99 00
Equity ratio**, %
48 51 50 65 61
40
96 97 98 99 00
Operating margin*, %
2.8 4.2 4.7 5.4 4.7
7
5
▲
Wanted position in 2005
In each of our businesses:
• number one in image and customer
satisfaction
• sustainable profitability above
average
• number one or two in size, or
superior growth rate
* Excluding divested operations ** Excluding Financial Services
11