Volvo 2000 Annual Report Download - page 101
Download and view the complete annual report
Please find page 101 of the 2000 Volvo annual report below. You can navigate through the pages in the report by either clicking on the pages listed below, or by using the keyword search tool below to find specific information within the annual report.-
 1
1 -
2
-
3
-
4
-
5
-
6
-
7
-
8
-
9
-
10
-
11
-
12
-
13
-
14
-
15
-
16
-
17
-
18
-
19
-
20
-
21
-
22
-
23
-
24
-
25
-
26
-
27
-
28
-
29
-
30
-
31
-
32
-
33
-
34
-
35
-
36
-
37
-
38
-
39
-
40
-
41
-
42
-
43
-
44
-
45
-
46
-
47
-
48
-
49
-
50
-
51
-
52
-
53
-
54
-
55
-
56
-
57
-
58
-
59
-
60
-
61
-
62
-
63
-
64
-
65
-
66
-
67
-
68
-
69
-
70
-
71
-
72
-
73
-
74
-
75
-
76
-
77
-
78
-
79
-
80
-
81
-
82
-
83
-
84
-
85
-
86
-
87
-
88
-
89
-
90
-
 91
91 -
 92
92 -
 93
93 -
 94
94 -
 95
95 -
 96
96 -
 97
97 -
 98
98 -
 99
99 -
 100
100 -
 101
101 -
 102
102 -
 103
103 -
 104
104 -
 105
105 -
 106
106 -
 107
107 -
 108
108 -
 109
109 -
 110
110 -
 111
111 -
112
 |
 |

99
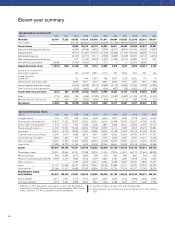
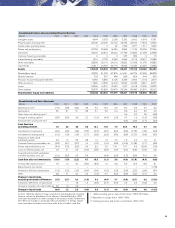
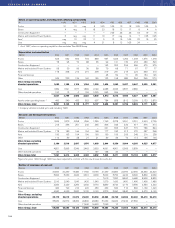
Consolidated balance sheet excluding Financial Services
SEK M 1990 1991 1992 1993 1994 1995 1996 1997 1998 1999 2000
Intangible assets 4,544 5,623 2,258 3,262 5,692 6,518 6,781
Property, plant and equipment 25,246 23,430 24,720 28,755 33,944 17,318 19,652
Assets under operating leases 0 0 49 1,366 1,817 1,611 4,245
Shares and participations 20,782 20,699 16,359 9,894 11,744 35,296 37,366
Inventories 23,047 23,813 23,042 27,756 31,883 21,053 22,998
Customer financing receivables 0 0 0 227 384 9 15
Interest bearing receivables 1,516 2,720 4,060 4,664 4,715 18,617 19,286
Other receivables 28,596 26,110 24,312 25,802 31,398 21,075 24,882
Liquid funds 21,811 20,637 23,170 16,605 15,439 24,465 10,958
Assets 125,542 123,032 117,970 118,331 137,016 145,962 146,183
Shareholders’ equity 43,332 51,200 57,876 61,951 69,375 97,692 88,338
Minority interests 703 351 448 859 804 544 593
Provision for post-employment benefits 6,060 6,855 3,126 3,266 2,904 2,118 2,619
Other provisions 11,806 12,525 12,618 15,962 19,435 9,861 8,277
Loans 24,266 16,301 13,432 1,047 5,018 12,206 18,233
Other liabilities 39,375 35,800 30,470 35,246 39,480 23,541 28,123
Shareholders’ equity and liabilities 125,542 123,032 117,970 118,331 137,016 145,962 146,183
As from 1992 the effects of major acquisitions and divestments of subsid-
iaries as well as the distribution of the shares in Swedish Match in 1996
have been excluded from other changes in the balance sheet. Furthermore
the effects of changes in exchange rates at translation of foreign subsid-
iaries have been excluded, since these effects do not affect cash flow.
1 1999, excluding gain on sale of Volvo Cars of SEK 26.7 billion.
2 Reported on a single line in 1990–1996.
3 Including pensions and similar commitments 1990–1991.
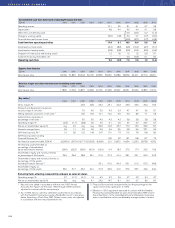
Consolidated cash flow statements
SEK bn 1990 1991 1992 1993 1994 1995 1996 1997 1998 1999 2000
Operating income 1(1.5) (0.5) (3.2) 0.5 9.4 10.4 3.9 8.7 6.9 6.7 6.2
Depreciation 3.0 3.1 3.1 3.8 5.1 5.6 5.4 6.8 9.6 5.2 6.3
Other items not affecting cash 20.6 0.0 0.5 (0.8)
Change in working capital 2(0.5) (0.4) 4.9 2.2 (1.4) (4.4) (1.9) 4.7 1.5 (1.0) (3.3)
Financial items and income tax 2(0.4) (2.0) (1.7) (0.4)
Cash flow from
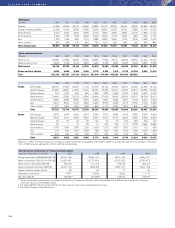
operating activities 1.0 2.2 4.8 6.5 13.1 11.6 7.4 20.4 16.0 9.7 8.0
Investments in fixed assets (4.6) (2.9) (2.9) (3.5) (4.3) (6.5) (8.2) (9.9) (10.5) (4.9) (5.4)
Investments in leasing assets (1.2) (1.0) (1.3) (1.7) (2.5) (2.6) (3.9) (9.8) (12.7) (5.6) (5.7)
Disposals of fixed assets
and leasing assets 0.2 1.2 0.3 0.8 1.4 1.3 2.0 1.8 2.6 1.6 2.1
Customer financing receivables, net (0.3) (0.1) (3.7) 1.9 (1.5) (1.6) (4.8) (15.5) (12.8) (7.1) (4.5)
Shares and participations, net (5.4) (7.2) (0.2) 0.5 8.2 2.0 14.1 10.7 5.5 (25.9) (1.6)
Loans to external parties, net 0.3 0.1 0.5 (0.2) (0.9) (0.9) (1.9) (0.4) (0.3) (3.2) 0.3
Acquired and divested subsidiaries
and other business units, net (1.0) (0.2) 0.3 0.4 – (4.4) (0.9) (1.3) (5.6) 31.0 0.0
Cash flow after net investments (11.0) (7.9) (2.2) 4.7 13.5 (1.1) 3.8 (4.0) (17.8) (4.4) (6.8)
Increase (decrease) in loans 37.9 1.3 3.2 (5.9) (8.3) 1.5 6.8 5.6 19.5 16.3 8.1
Repurchase of own shares ––––––––––(11.8)
Dividend to AB Volvo shareholders (1.2) (1.2) (1.2) (0.6) (0.6) (1.5) (1.9) (2.0) (2.2) (2.6) (3.1)
Other 2.8 7.1 0.4 0.2 (1.3) 0.7 (5.0) (5.9) (0.2) (0.1) 0.0
Change in liquid funds,
excluding translation differences (1.5) (0.7) 0.2 (1.6) 3.3 (0.4) 3.7 (6.3) (0.7) 9.2 (13.6)
Translation differences on liquid funds – – 1.8 1.3 (0.3) (0.7) (0.3) 0.3 0.3 (0.2) 0.3
Change in long-term securities holdings 0.6 1.9 0.9 ––––––––
Change in liquid funds (0.9) 1.2 2.9 (0.3) 3.0 (1.1) 3.4 (6.0) (0.4) 9.0 (13.3)