Volvo 2000 Annual Report Download - page 26
Download and view the complete annual report
Please find page 26 of the 2000 Volvo annual report below. You can navigate through the pages in the report by either clicking on the pages listed below, or by using the keyword search tool below to find specific information within the annual report.-
 1
1 -
2
-
3
-
4
-
5
-
6
-
7
-
8
-
9
-
10
-
11
-
12
-
13
-
14
-
15
-
 16
16 -
 17
17 -
 18
18 -
 19
19 -
 20
20 -
 21
21 -
 22
22 -
 23
23 -
 24
24 -
 25
25 -
 26
26 -
 27
27 -
 28
28 -
 29
29 -
 30
30 -
 31
31 -
 32
32 -
 33
33 -
 34
34 -
 35
35 -
 36
36 -
37
-
38
-
39
-
40
-
41
-
42
-
43
-
44
-
45
-
46
-
47
-
48
-
49
-
50
-
51
-
52
-
53
-
54
-
55
-
56
-
57
-
58
-
59
-
60
-
61
-
62
-
63
-
64
-
65
-
66
-
67
-
68
-
69
-
70
-
71
-
72
-
73
-
74
-
75
-
76
-
77
-
78
-
79
-
80
-
81
-
82
-
83
-
84
-
85
-
86
-
87
-
88
-
89
-
90
-
91
-
92
-
93
-
94
-
95
-
96
-
97
-
98
-
99
-
100
-
101
-
102
-
103
-
104
-
105
-
106
-
107
-
108
-
109
-
110
-
111
-
112
 |
 |
24
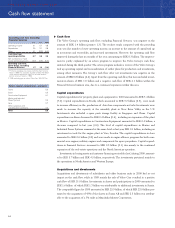
Cash flow
The Volvo Group’s operating cash flow, excluding Financial Services, was negative in the
amount of SEK 1.4 billion (positive 1.3). The weaker result, compared with the preceding
year, was due mainly to lower operating income, an increase in the amount of capital tied up
in inventories and receivables, and increased investments. However, the operating cash flow
improved during the last six months of the year, amounting to SEK 0.3 billion. The improve-
ment is partly explained by an action program to improve the Volvo Group’s cash flow,
initiated during the third quarter. The action program includes a review of the Volvo Group’s
tied up operating capital and reconsideration of earlier plans for production and investments,
among other measures. The Group’s cash flow after net investments was negative in the
amount of SEK 6.8 billion (4.4). Apart from the operating cash flow, this item included invest-
ments in shares of SEK 1.6 billion and a negative cash flow of SEK 4.1 billion within the
Financal Services business area, due to a continued expansion within this area.
Capital expenditures
Capital expenditures for property, plant and equipment in 2000 amounted to SEK 5.4 billion
(5.2). Capital expenditures in Trucks, which amounted to SEK 3.2 billion (2.5), were made
to increase efficiency in the production of drive-line components and cabs. Investments were
made to increase the capacity at the assembly plant in New River Valley in the U.S.
Investments also included a spare parts storage facility in Singapore and China. Capital
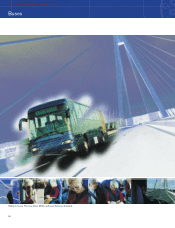
expenditures in Buses decreased to SEK 0.4 billion (0.6), including an expansion of the plant
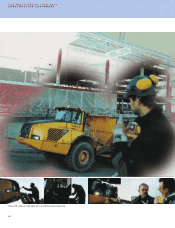
in Mexico. Capital expenditures in Construction Equipment amounted to SEK 0.4 billion, a
decrease compared to last year (0.6). The level of capital expenditures in Marine and
Industrial Power Systems remained at the same level as last year, SEK 0.1 billion, including an
investment in tools for the engine plant in Vara, Sweden. The capital expenditures in Aero
amounted to SEK 0.6 billion (0.8) and were made in engine alliance programs for both com-
mercial aero engines, military engines and components for space propulsion. Capital expend-
itures in Financial Services increased to SEK 0.3 billion (0.1) due mainly to the continued
expansion of the real-estate operations and the North American operation.
Investments in leasing assets and customer financing receivables (net) during 2000, amount-
ed to SEK 5.7 billion and SEK 4.5 billion, respectively. The investments pertained mainly to
the operations in North America and Western Europe.
Acquisitions and divestments
Acquisitions and divestments of subsidiaries and other business units in 2000 had no net
impact on the cash flow, while in 1999 mainly the sale of Volvo Cars resulted in a positive
cash flow of SEK 31.0 billion. Investments in shares and participations in 2000 amounted to
SEK 1.6 billion of which SEK 1.3 billion was attributable to additional investments in Scania.
The comparable figure for 1999 amounted to SEK 25.9 billion, of which SEK 23.0 billion per-
tained to the acquisition of 43% of the shares in Scania AB and SEK 2.3 billion was attribut-
able to the acquisition of a 5% stake in Mitsubishi Motors Corporation.
THE VOLVO GROUP YEAR 2000
Cash flow statement
▲
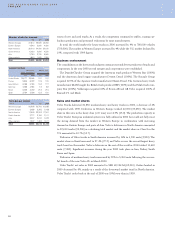
Future capital expenditures, approved
Trucks 5.3
Buses 0.5
Construction Equipment 0.1
Marine and Industrial
Power Systems 0.0
Aero 0.7
Other companies and
undistributed investments 0.2
Total 6.8
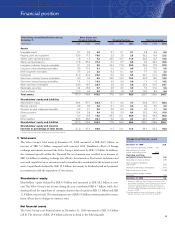
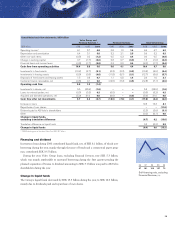
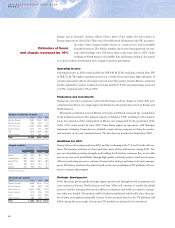
Operating cash flow, excluding
Financial Services
199811999 2000
Operating income23.1 5.7 4.8
Depreciation 3.5 3.1 3.8
Other 0.1 (3.2) (5.0)
Cash flow from
operating activities 6.7 5.6 3.6
Net investments in fixed
assets and leasing assets (5.0) (4.3) (5.0)
Operating cash flow,
Volvo Group, excluding
Financial Services 1.7 1.3 (1.4)
1 Pro forma, excluding Cars. Volvo's cash flow from financial
items in 1998 has also been adjusted to reflect the effects
of the amount received for Volvo Cars and the amounts
paid for shares in Scania in 1999.
2 1999: excluding gain on sale of Volvo Cars, SEK 26.7 bn.